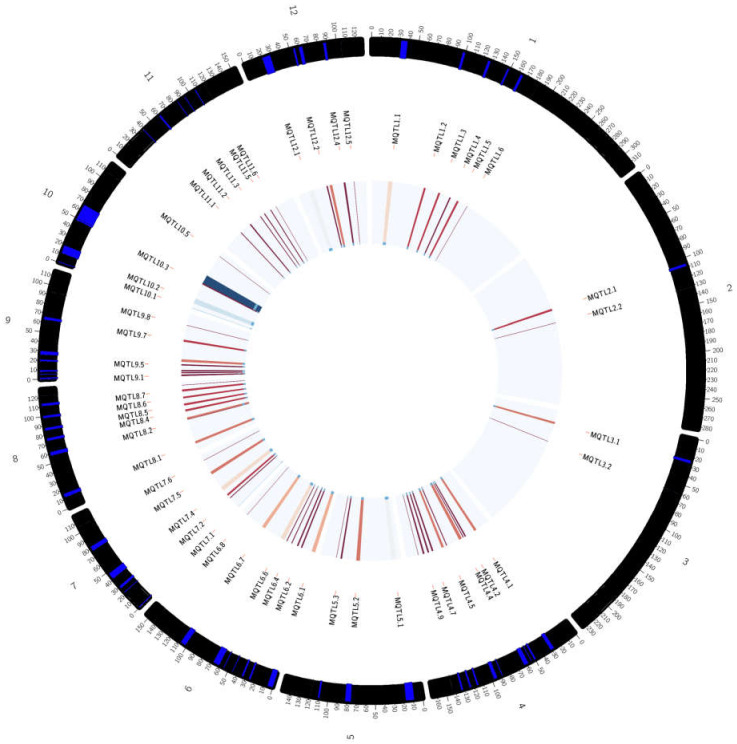
Figure 5.
Circular representing the overall meta-QTL information including meta-QTL names, the position of the meta-QTLs in the chromosome, and the frequency of QTLs involved for each meta-QTL mapped. The outer ring indicates the position of the meta-QTLs in the chromosome, the middle circle is related to the meta-QTL names, and the centre circle reflects the frequency of QTLs involved for each meta-QTL mapped (the frequency increases from lighter to darker color—red to blue).

