
Figure 6.
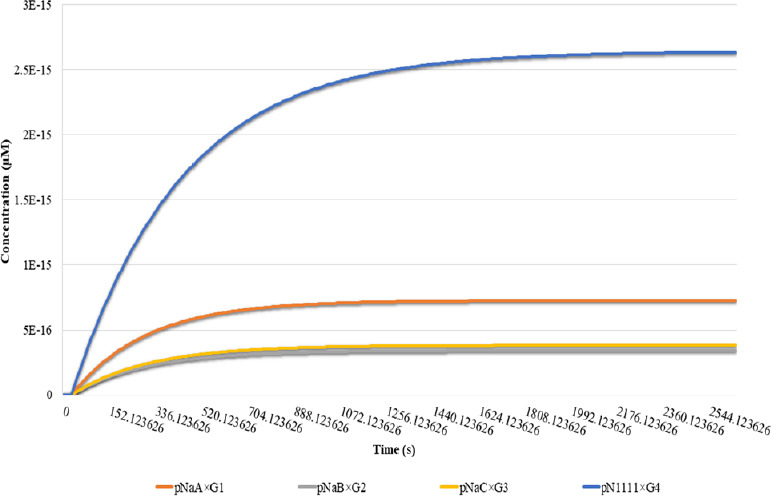
Binding of Nav species with AnkG species (G1, G2, G3, and G4) under different phosphorylation conditions.
The effect of the presence and absence of serine sites within Nav channels is shown. Time in seconds on x-axis explains the simulation time and y-axis describe the concentration Nav channels (pNaA, pNaB, pNaC, and pN1111) after binding with AnkG (G1, G2, G3, and G4). The blue line represents the highest concentration of pN1111 due to the presence of all four serine sites for casein kinase 2-mediated phosphorylation. The orange line denotes the effect of the absence of two serine residues on the pNaA concentration. The concentration of the remaining two phosphorylated Nav species (pNaC and pNaB) are found to be at a similar level. However, their concentrations are lower than the concentrations of pN1111 and pNaA. AIS: Axon initial segment; AnkG: ankyrin-G; Nav: voltage-gated sodium channel.