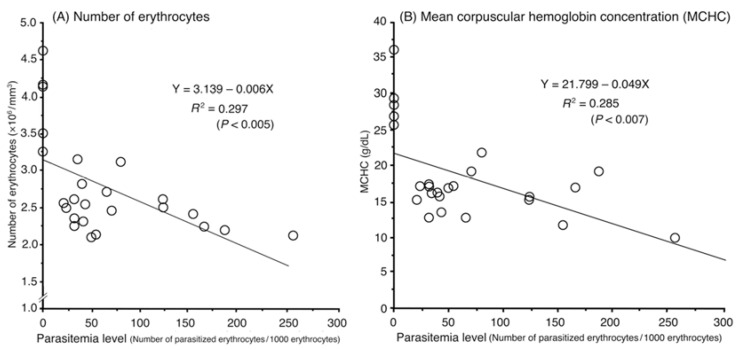
Figure 2.
Relationship between Haemoproteus columbae parasitemia level (number of parasitized erythrocytes/1000 erythrocytes) and number of erythrocytes (×106/mm3) (A) or mean corpuscular hemoglobin concentration (MCHC; g/dL) (B). Each open circle represents one individual farmed pigeon. Linear regressions shown in A and B are statistically significant with R2 = 0.297 and 0.285, respectively.

