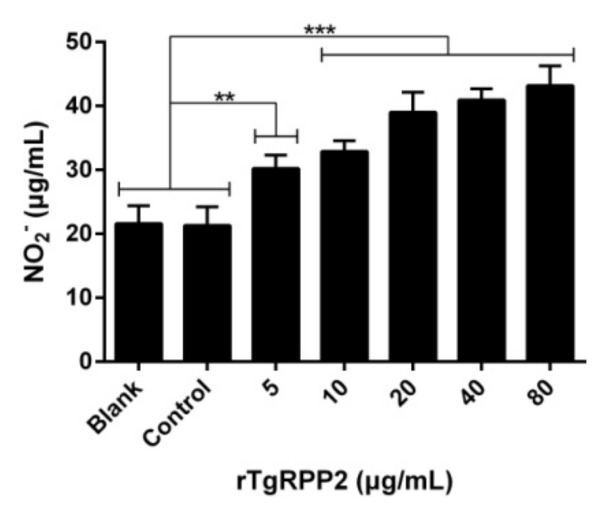
Figure 6.
Effect of rTgRPP2 on the NO production of murine Ana-1 cells. Through treatment with different concentrations of rTgRPP2 for 48 h, the NO concentrations were determined. Values were evaluated using one-way ANOVA analysis, followed by Dunnett’s test, and presented as the mean ± standard deviation of three independent experiments (n = 3). ** p < 0.01 and *** p < 0.001 compared with the blank group or the control group.

