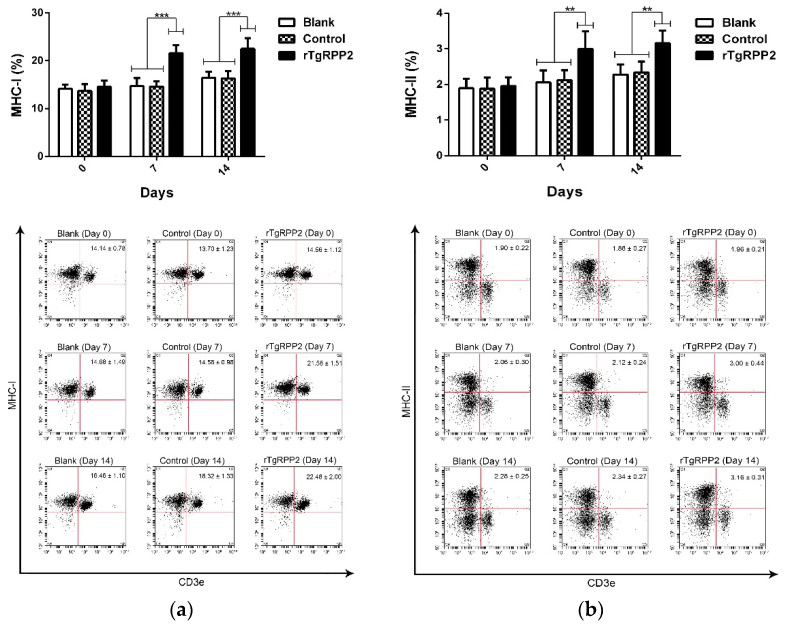
Figure 10.
Flow cytometry analysis of major histocompatibility complex (MHC) class I (a) and MHC class II (b) molecules in murine spleen lymphocytes. Results were evaluated using one-way ANOVA analysis, followed by Dunnett’s test, and values are shown as the mean ± standard deviation (n = 5). ** p < 0.01 and *** p < 0.001 compared with the blank group or the control group.

