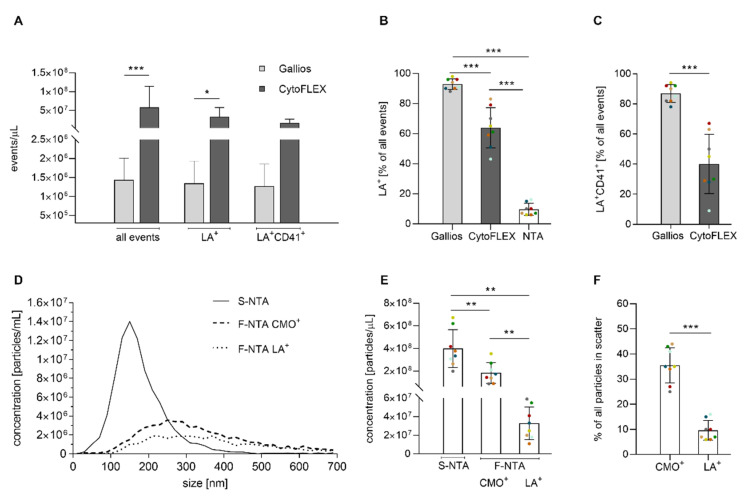
Figure 2.
Comparative analysis of platelet-derived EVs using flow cytometry and NTA. (A) number of events detected by flow cytometry with Gallios vs. CytoFLEX LX; (B) percentage of LA+ events detected by flow cytometry using Gallios or CytoFLEX LX vs. percentage of LA+ particles detected by NTA in fluorescence mode; the percentages refer to the entirety of events detected with flow cytometry and NTA, respectively; (C) percentage of LA+CD41+ events for Gallios vs. CytoFLEX LX; (D) size distribution of platelet-derived EVs determined by NTA. Size distribution of EVs determined by S-NTA and F-NTA after staining with the unspecific membrane dye CMO (F-NTA CMO+) or with LA-AF555 (F-NTA LA+) as marker for phosphatidylserine exposing vesicles; (E) particle concentration detected by S-NTA and F-NTA (CMO+ and LA+); (F) percentage of CMO+ and LA+ particles detected by F-NTA. Data are presented as mean ± SD (n = 8, same batches used for all measurements; * p < 0.05; ** p < 0.01; *** p < 0.001).

