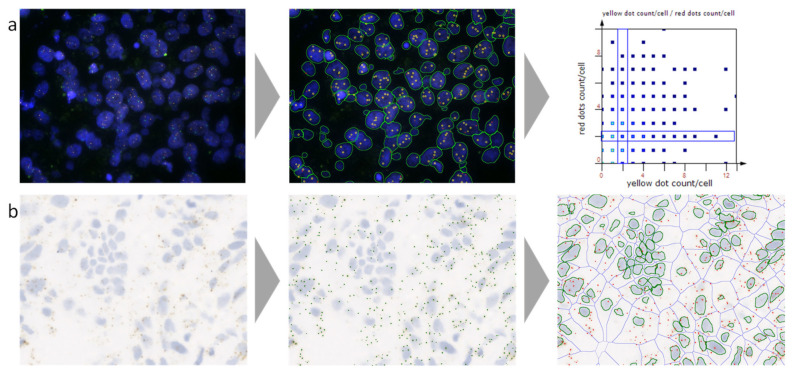
Figure 2.
A representative example of automated analysis of fluorescence in situ hybridization (FISH) and RNA in situ hybridization (ISH) stained cells using a next-generation digital pathology platform. (a) FISH staining (blue, nuclei stained for 4′,6-diamidino-2-phenylindole (DAPI); red and yellow dots, FISH probes); on the left the original image is shown, in the middle the corresponding analyzed image including cell and dot detection mask, and on the right the analyzed data visualized in a scattergram. (b) RNAscope staining (blue, nuclei stained for hematoxylin; brown, RNAscope staining); on the left the original image is shown, in the middle the original image overlaid with the detected dot mask, and on the right the original image overlaid with the nuclei mask, the cellular mask, and the identified dot mask. Both images were provided by and analyzed using TissueGnostics’ image cytometry solution StrataQuest.

