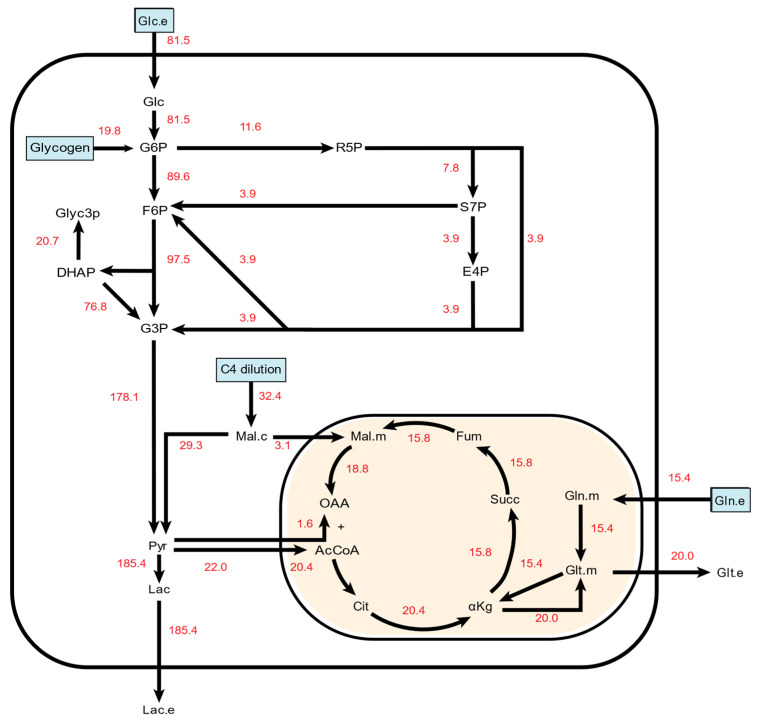
Figure 2.
A simplified metabolic flux map depicting net metabolic fluxes in untreated HUVECs. All numbers are given in nmol/cells/hr. Carbon sources in the final model are indicated in light blue boxes. To simplify PPP pathway visualization, only the unique metabolites formed in each reaction are depicted along with the net PPP-based production of F6P and G3P. Full information on reaction schemes, atom transition specifications, and fluxes can be found in Supplemental File S1.

