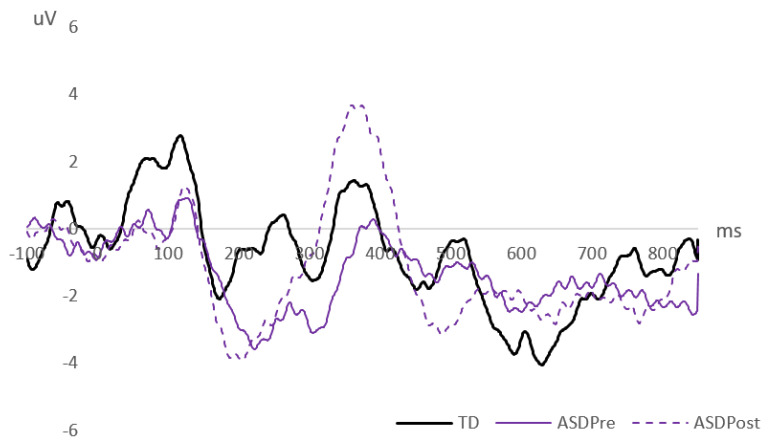
Figure 3.
Difference waveforms (deviants-minus-standard), combined across emotions and electrode sites, resulting in a single grand average difference waveform for each group—TD children (thick solid [black] line), and ASD children pre- (thin solid [purple] line) and post-intervention (thin dotted [purple] line). Response amplitudes are measured in microvolts (μV) and time in milliseconds (ms).

