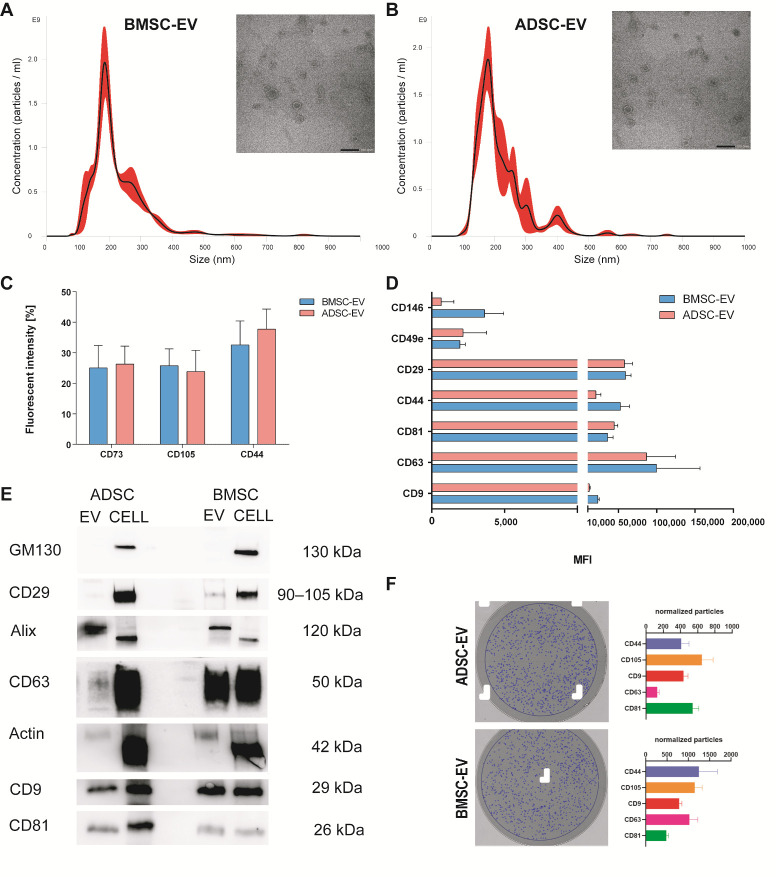
Figure 1.
BMSC and ADSC-EV Characterization. EVs were isolated by BMSCs and ADSCs and analyzed using different techniques. Representative Nanoparticle tracking analyses showing the size distribution and representative Transmission electron microscopy of EVs derived from BMSCs (A) and ADSCs (B) with scale bar 100 nm; (C) flow cytometry analysis (FACS) of EVs for surface proteins CD73, CD105 and CD44 showing the percentage of fluorescent intensity; (D) MACS multiplex bead-based flow cytometry assay of different surface markers, only expressed markers are shown as mean fluorescent intensity (MFI); (E) representative Western blot analysis of integrin β1 (CD29), Actin, exosomal markers CD63, CD9, CD81, Alix, and intracellular marker GM130 as negative control for exosomes in BMSC and ADSC-EVs and cells of origin; (F) Interferometry images of a representative anti-CD9 capture spot post-scan for ADSC-EVs (upper-left) and BMSC-EVs (lower-left). Blue circles indicate EVs detected by interferometry. Histograms show the number of normalized particles counted by interferometry for each capturing antibody (CD9, CD63, CD81, CD44, CD105).

