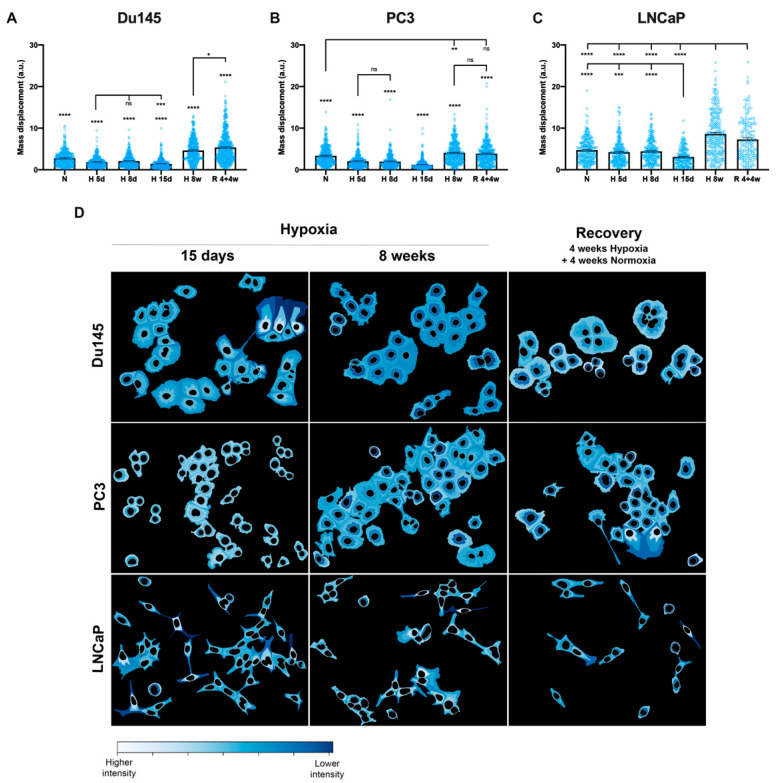
Figure 5.
AQP3 cytoplasmic distribution. Mass displacement for AQP3 cytoplasmic labeling is shown for (A) Du145, (B) PC3 and (C) LNCaP cells. (D) Fraction of distance graphical representation of AQP3 intensity in the cytoplasmic compartment, using 4 bins. Scale of intensity is normalized for each image individually, for its maximum and minimum intensity, with a lighter color representing the highest intensity. Data from CellProfiler, from cells under acute hypoxia (5 d, 8 d, 15 d—days 5, 8 and 15), chronic hypoxia (8 w—8 weeks) and recovery (4 + 4 w—4 weeks hypoxia + 4 weeks normoxia). Each condition has, on average, 278 (Du145), 319 (PC3) and 217 (LNCaP) individual cells and data are shown as mean ± SEM. **** p < 0.0001, *** p < 0.001, ** p < 0.01, * p < 0.05, ns—not significant.

