Figure 3.
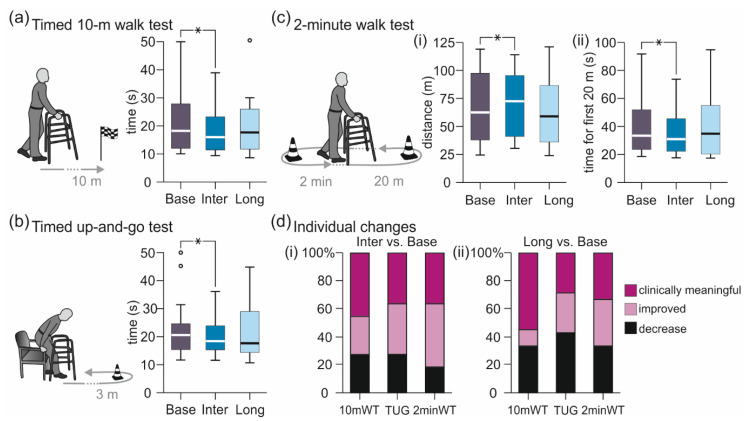
Intermediate and longer-lasting carry-over effects of transcutaneous spinal cord stimulation on walking function. Group results of the evaluations Base, Inter, and Long of (a) the timed 10-m walk test; (b) the timed up-and-go test; and (c) (i) distance of the 2-min walk test as well as (ii) time required to cover the first 20-m course length, illustrated by box plots. Bold horizontal lines within boxes are medians; boxes span the interquartile range. Whiskers extend to the lowest and largest values that are not outliers (illustrated as circles; see Methods). Brackets and asterisks denote significant results of post-hoc pairwise comparisons (*, p < 0.05). (d) Individual changes in walk tests in (i) Inter and (ii) Long compared to Base. Stacked bar charts of the timed 10-m meter walk test (10mWT), the timed up-and-go test (TUG) and the 2-min walk test (2minWT) show percentage of changes classified as clinically relevant improvement (10mWT, increase of walking speed by ≥ 0.05 m/s; TUG, time reduced by ≥ 15%; and 2minWT, distance increased by ≥ 6.8 m), improvement, and decrease. Base, baseline evaluation comprising two assessments conducted ~24 h and immediately pre-intervention; Inter, evaluation of intermediate carry-over effects comprising two assessments conducted immediately and two hours post-intervention; Long, evaluation of longer-lasting carry-over effects conducted ~24 h post-intervention.

