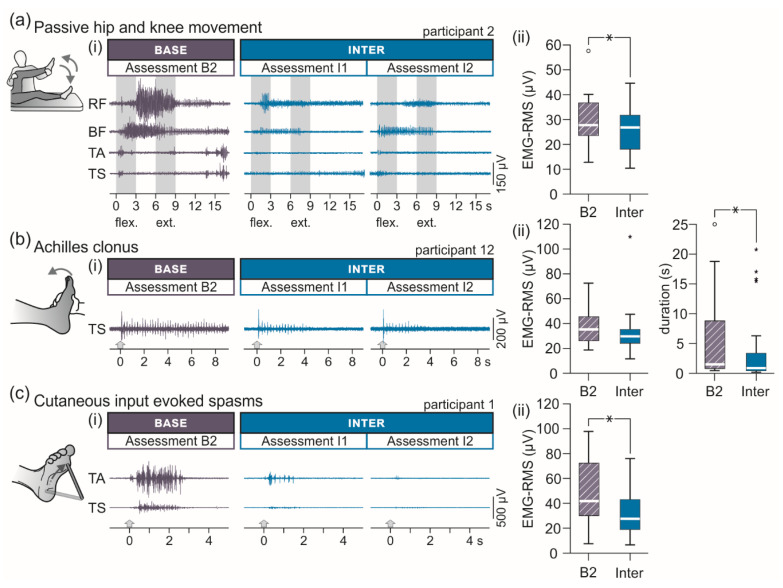
Figure 5.
Intermediate carry-over effects of transcutaneous spinal cord stimulation on various presentations of lower-extremity spasticity assessed with surface-electromyography. (a) Lower-extremity muscle activation through tonic stretch reflexes during passive unilateral hip and knee flexion (flex.) and extension (ext.) movements. (i) Electromyographic (EMG) recordings derived from rectus femoris (RF), biceps femoris (BF), tibialis anterior (TA), and triceps surae (TS) in assessments B2 as well as I1 and I2; participant 2. (ii) Group results of the root mean square (RMS) values of the EMG in B2 and Inter. (b) Achilles clonus elicited by a brisk manual dorsiflexion. (i) EMG recordings of TS in B2 as well as I1 and I2; participant 12. Arrows mark onsets of the tests. (ii) Group results of the EMG-RMS values (left) and clonus duration (right) in B2 and Inter. (c) Cutaneous-input evoked lower-extremity spasms. (i) EMG recordings of TA and TS in B2 as well as I1 and I2; participant 1. Arrows mark onsets of the tests. (ii) Group results of the EMG-RMS values in B2 and Inter. B2, baseline assessment conducted immediately pre-intervention; Base, baseline evaluation; Inter, evaluation of intermediate carry-over effects comprising two assessments immediately (I1) and two hours (I2) post-intervention. All group results are illustrated by box plots. Bold horizontal lines within boxes are medians; boxes span the interquartile range. Whiskers extend to the lowest and largest values that are not outliers (illustrated as circles; see Methods) or extreme values (asterisks). Brackets and asterisks denote significant results of post-hoc pairwise comparisons (*, p < 0.05).

