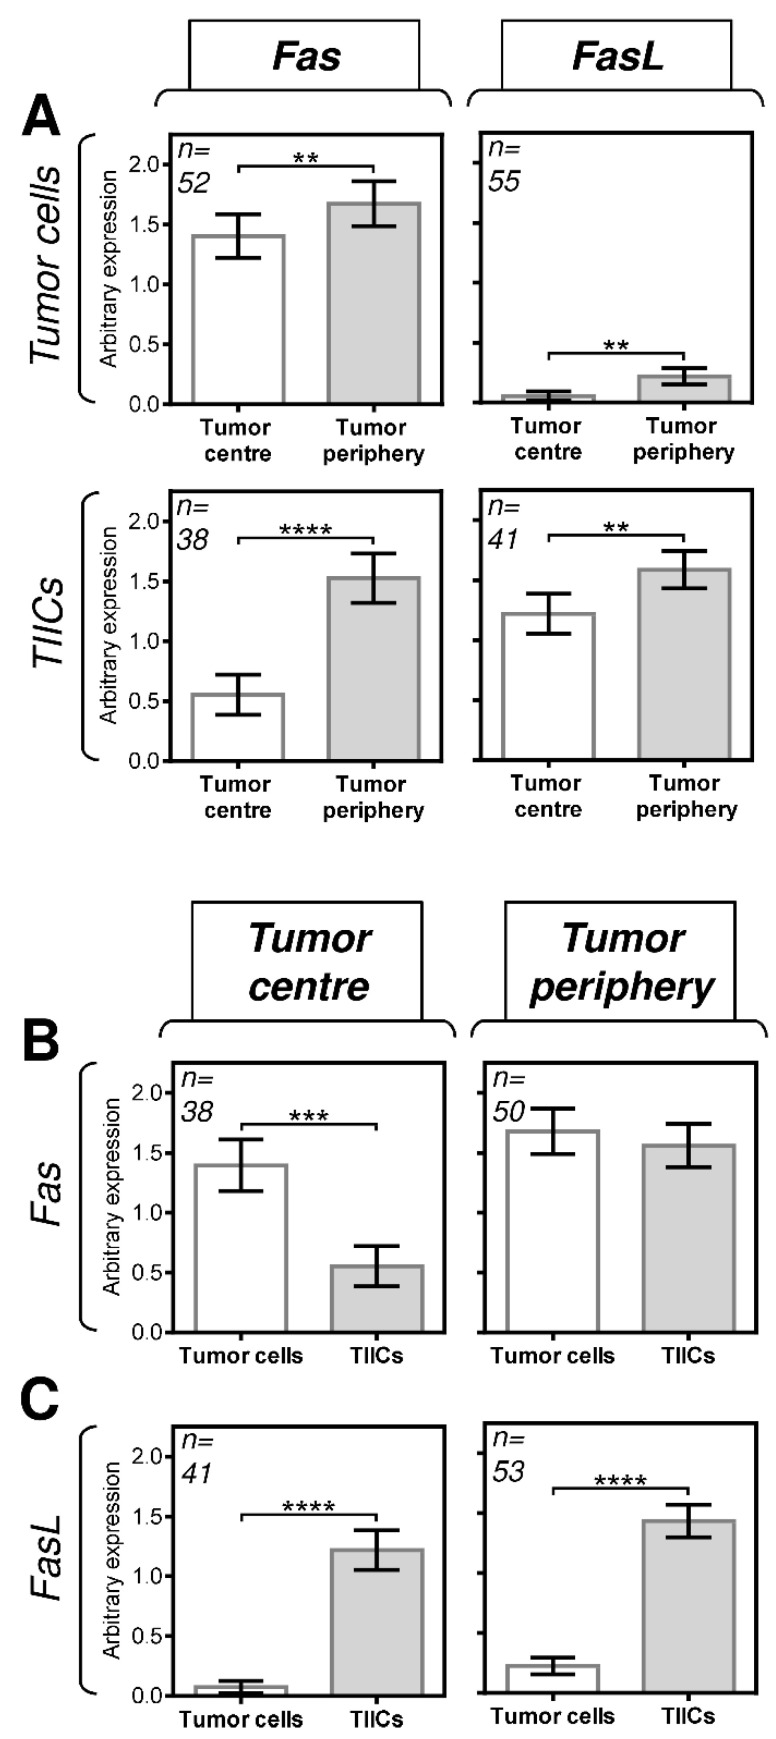
Figure 2.
The expression of Fas and FasL in tumor cells and TIICs in the tumor periphery and center. (A) The expression (tumor proportion score (TPS)) of Fas and FasL in tumor cells and TIICs is higher in the tumor periphery than in the tumor center. The number of patients (n) evaluated is shown in the top left corner of each panel. (B) The expression of Fas in tumor cells is higher than that in TIICs in the tumor center but comparable to that in the tumor periphery. (C) The expression of FasL in tumor cells is lower than that in TIICs in both the tumor center and tumor periphery. In A–C, the expression analyses were performed according to the TPS scoring system described in the Materials and Methods section. The data are presented as the mean ± SEM of the TPS score calculated from the TPS scores of individual patients’ samples. The number of patients (n) evaluated is shown in the top left corner of each panel. The difference between groups was evaluated by the Mann–Whitney U test (n is shown in the top left corner of each panel, ** p < 0.01, *** p < 0.001, and **** p < 0.0001).

