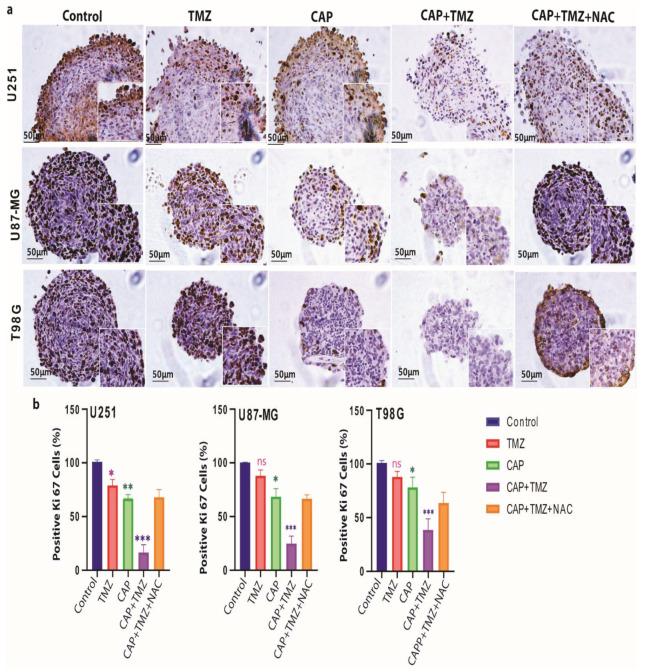
Figure 4.
Effect of CAP (COST jet), TMZ (40 µM for U251, and 72 µM for U87-MG and T98G) and their combination treatment on the expression of the proliferative marker Ki-67 in GBM spheroids; (a) representative images of Ki-67 staining, showing the reduction in the proliferation marker Ki67+ in U251, U87-MG and T98G spheroids compared to control, following TMZ, CAP, CAP + TMZ and CAP + TMZ + NAC treatment. The enlarged image demonstrates variable ki67 staining. (b) The staining was scored using ImageJ software. Data are representative of two independent experiments, 4–6 spheroids per condition. Mean ± SD. Statistically significant differences were found between the untreated control and corresponding treated samples. * = p ≤ 0.05; ** = p ≤ 0.01; *** = p ≤ 0.001, ns = not significant. NAC: N-Acetyl-L-cysteine.

