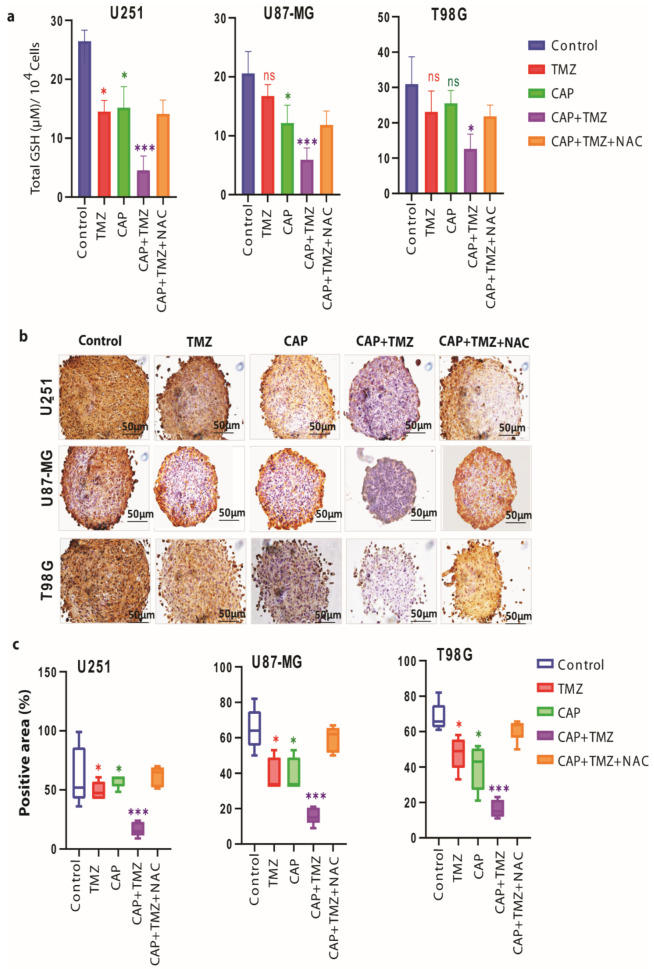
Figure 6.
Changes in intracellular GSH levels and cellular GPX4 protein expression upon treatment with CAP (3 min, COST jet), TMZ (40 µM for U251, and 72 µM for U87-MG and T98G) alone and their combination (CAP + TMZ) in the presence or absence of NAC, in U251 (TMZ-sensitive), U87-MG and T98G (TMZ-resistant) spheroids. (a) Cellular levels of glutathione (GSH) upon treatment. Statistical analysis was performed using one-way analysis of variance (ANOVA), with Tukey’s comparison analysis. The data were considered significantly different when * = p ≤ 0.05; *** = p ≤ 0.001. (b) Histochemical staining, showing the reduction in the GPX4 protein expression (brown color) in the U251, U87-MG and T98G spheroids compared to control, following TMZ, CAP, CAP + TMZ and CAP + TMZ + NAC treatment. (c) GPX4 protein expression quantified using ImageJ software in CAP, TMZ alone and their combination (CAP + TMZ), as well as CAP + TMZ + NAC, versus untreated cells (control). Data are representative of two independent experiments, 4–6 spheroids per condition. Mean ± SD. Statistically significant differences were found between the untreated control and corresponding treated samples; ns = non-significant.

