Figure 4.
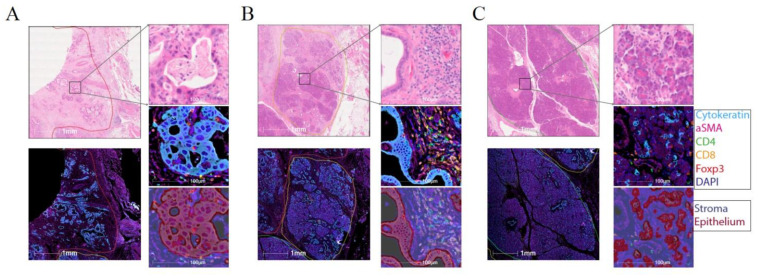
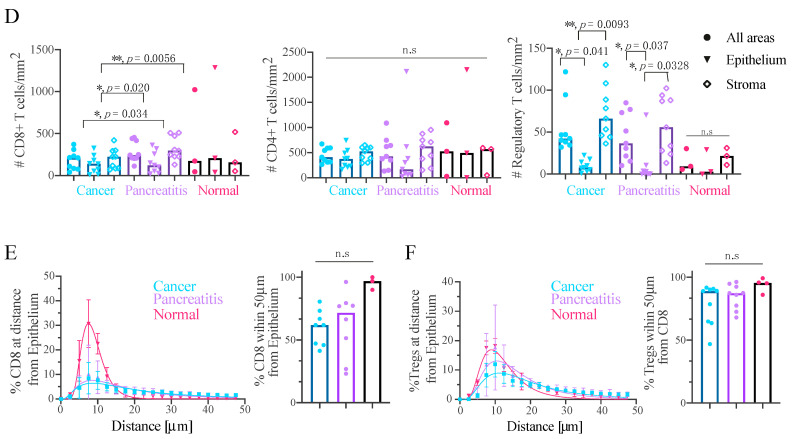
Multiplex imaging of T-cell distribution within PDAC tumours identifies a stroma restricted Treg compartment. (A) 2× magnification (left) of a cancer region showing H&E (top) and immunofluorescence (bottom). 40× magnification (right) of a region from (left) showing H&E staining (top), the fluorescence signal (middle) and the region classification into epithelium and stroma (bottom). (B) As in (A) for a region exhibiting pancreatitits. (C) As in (A) for a normal pancreas region. (D) Infiltration of CD8+ T-cells (left), CD4+ T-cells (middle) and Tregs (right) into the tissue (Cancer, Pancreatitis and Normal), as well as sub-tissue architectural distribution between the epithelium-rich and stroma-rich areas. Mixed-effect ANOVA with Tukey’s correction. (E) Proximity analysis of CD8+ T-cells distance distribution within 50 µm of epithelial cells fitted using a lognormal distribution with geometric means and R2 as follows: Cancer: 17.21 µm, 0.80; Pancreatitis 14.55 µm, 0.79; Pancreas: 8.46 µm, 0.99. (F) Proximity analysis of Treg distance distribution within 50 µm of CD8+ T-cells, fitted using a lognormal distribution with geometric means and R2 as follows: Cancer: 16.75 µm, 0.84; Pancreatitis 14.28 µm, 0.82; Pancreas: 11.24 µm, 0.92. Scale bars: 1 mm (for 2× magnification) and 100 mm (for 40× magnification).


