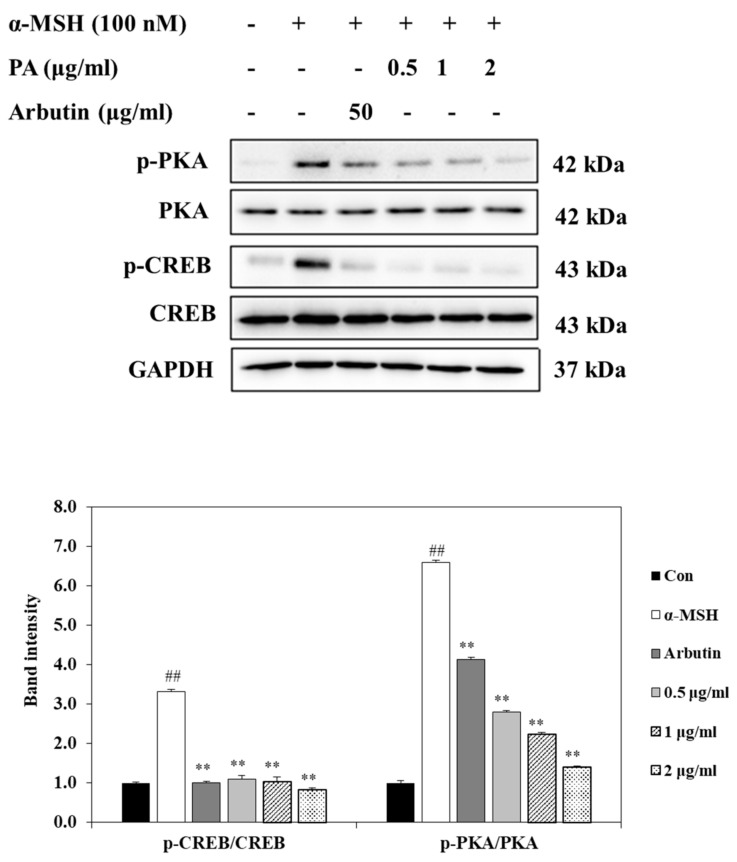
Figure 4.
PA suppresses the PKA and CREB signaling pathways in α-MSH-stimulated B16F10 cells. Cells were exposed to 100 nM α-MSH in the presence of PA at the indicated concentrations or 50 µg/mL arbutin. The protein expression levels of p-PKA/PKA and p-CREB/CREB were determined using Western blot analysis and quantified using Image J. Values are expressed as means ± SDs of triplicate experiments (n = 3). Note: ## p < 0.01 compared to the untreated control group; ** p < 0.01 compared to α-MSH group.

