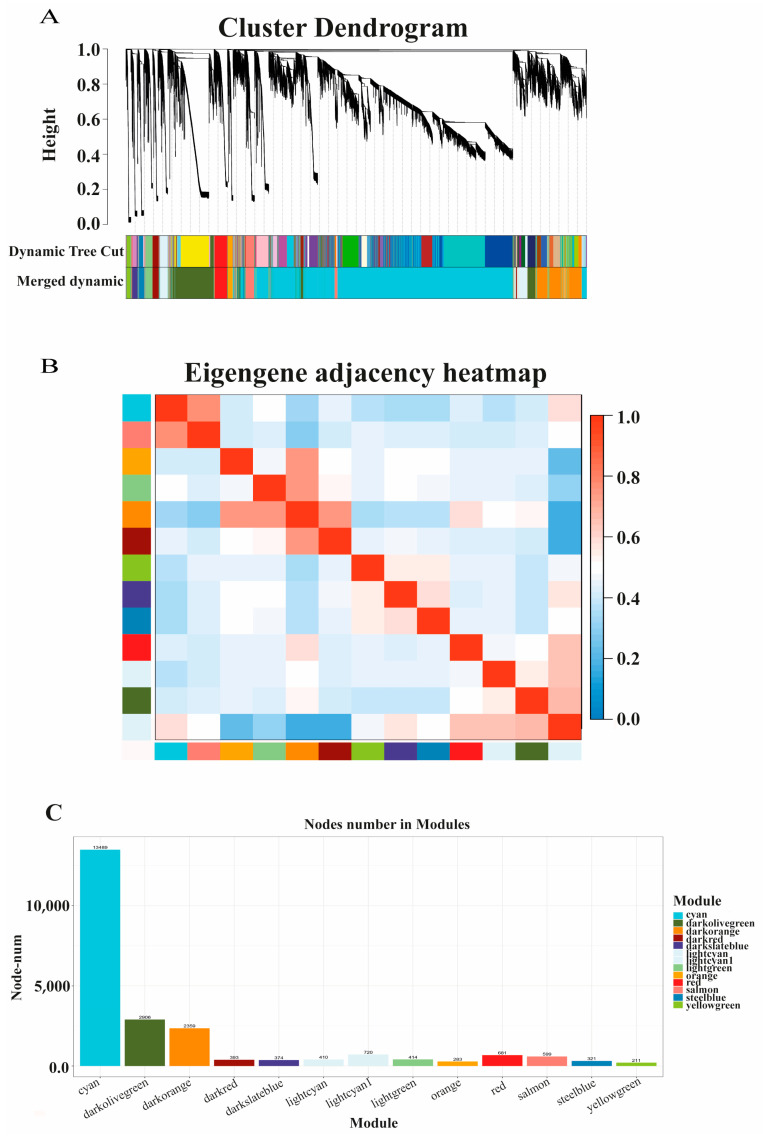
Figure 5.
Weighted gene co-expression network analysis (WGCNA). (A) Hierarchical clustering dendrogram of lncRNA–mRNA co-expression modules. Each branches represents a cluster of lncRNAs or mRNAs. Dynamic tree cut represents original split module, and merged dynamic represents final merged modules. (B) Hierarchical clustering dendrogram of module eigengenes and heatmap of adjacencies using WGCNA; red and blue indicate positive and negative correlation, respectively. (C) Number of module genes; histogram represents numbers of lncRNAs or mRNAs in the co-expression module.

