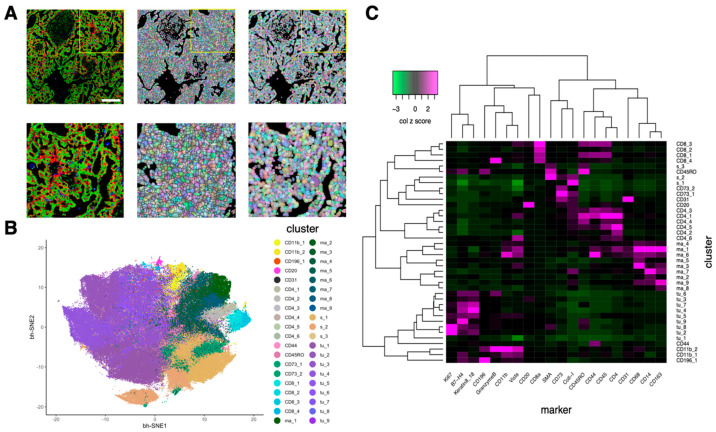
Figure 3.
Cell segmentation by mask-R-CNN and cell subtype annotation based on marker expression. (A). Comparison of watershed segmentation and mask-R-CNN segmentation. Left, imaging mass cytometry (IMC) image; red: Keratin8/18, green: histone H3, blue: CD68. Middle, watershed segmentation. Right, mask-R-CNN segmentation. Bottom three images are the zoomed-in images of the yellow rectangle region of the top three images. White scale bar, 200 μm. (B). Two-dimensional bh-SNE representation of multiplexed IMC data highlighted by cell subtypes generated by phenograph clusterings. Each dot represents one cell. (C). Heatmap showing the median marker expression (z-scored by column) of each cluster (cell subtype). Twenty markers and 40 clusters were ordered by hierarchical clustering with the distance based on Pearson correlation.

