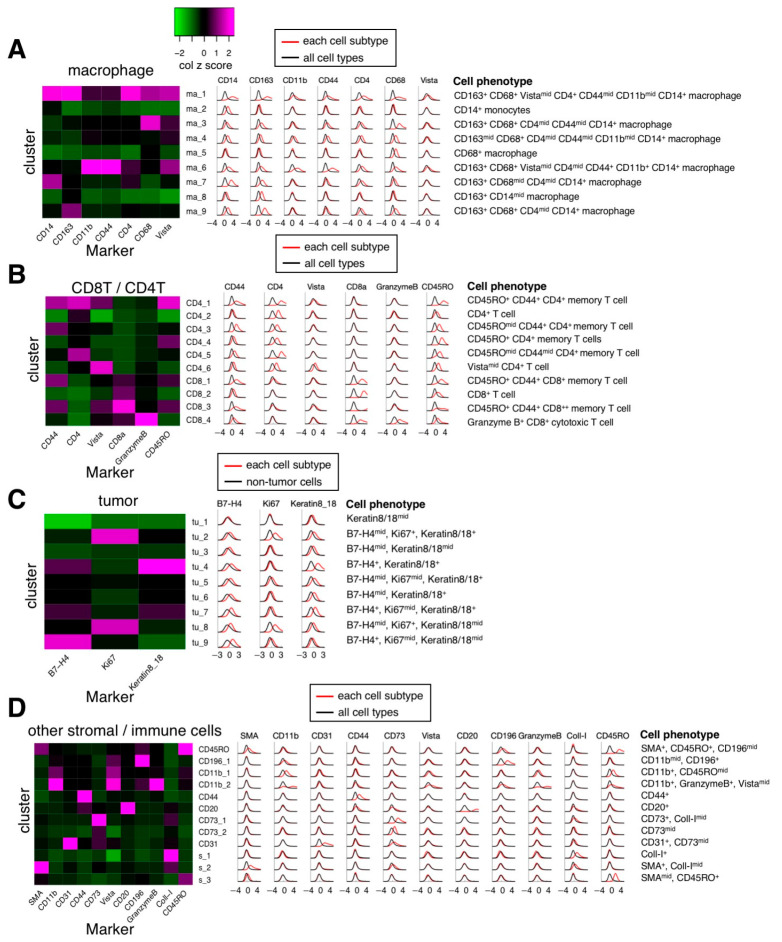
Figure 4.
Marker expression levels of major individual cell subtypes. Left, heatmaps of median marker expression level (z-scored by column) for different major cell subtypes. Middle, histograms of Gaussian-smoothed (σ = 0.5) normalized marker expression levels of the cells of each cell subtype across all samples (red line) and normalized marker expression levels of the cells of all cell subtypes across all samples (black line, (A,B,D)) or normalized marker expression levels of the cells of non-tumor cells across all samples (black line, (C)). Right, summary of phenotypes of IMC cell subtypes. (A). Macrophage subtypes. (B). CD8+/CD4+ T cell subtypes. (C). Tumor subtypes. (D). Other immune cell subtypes.

