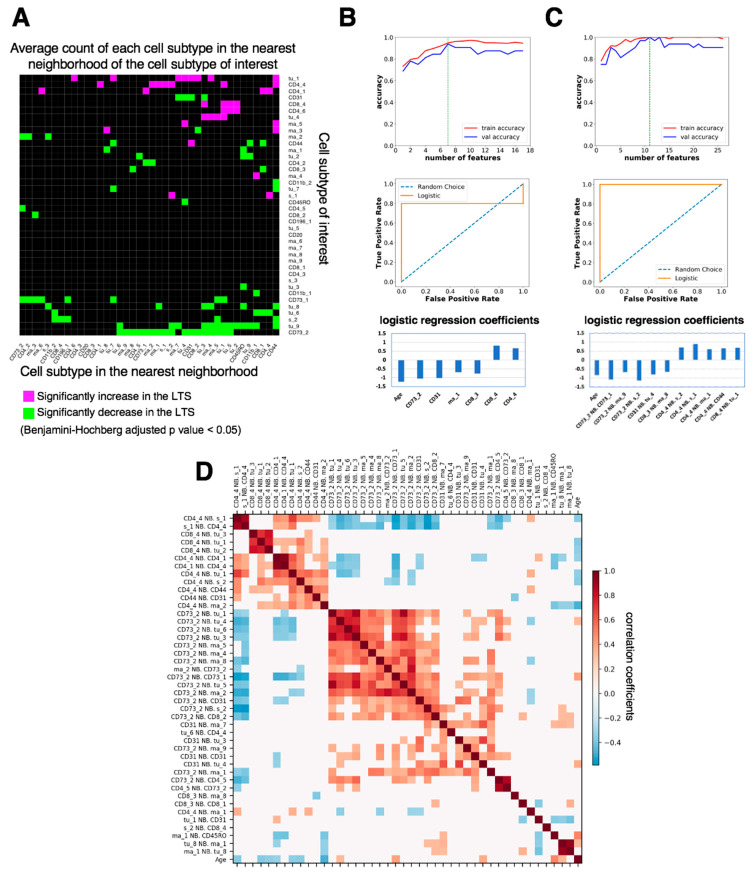
Figure 6.
Comparison of nearest-neighbor cell-cell interactions between long-term survivors (LTS) and short-term survivors (STS) and feature selection for patient survival prediction. (A). Map of significant increases and decreases in nearest-neighbor interactions, computed as the average number of cell subtype X in the nearest neighbor of cell subtype Y (distance between the center of X and Y less than 20 μm), that are significantly (Benjamini-Hochberg adjusted p value < 0.05) increased (magenta) or decreased (green) in LTS compared with STS. (B). (Top) Number of cell density features selected by recursive feature elimination as a function of training (red) or validation (blue) accuracy. The optimal number of features is indicated by the green dashed line. Validation was done by leave-one-out cross validation. (Middle) Receiver operating characteristic (ROC) curve for the test set. (Bottom) Logistic regression coefficients of the features selected by the model. (C) (Top) Number of features of nearest-neighbor cell-cell interactions selected by recursive feature elimination as a function of training (red) or validation (blue) accuracy. The optimal number of features is indicated by the green dashed line. Validation was done by leave-one-out cross validation. (Middle) Receiver operating characteristic curve for the test set. (Bottom) Logistic regression coefficients of the features selected by the model. (D). Spearman correlation between the features that both correlate with patient survival (absolute correlation coefficient > 0.2). White color indicates correlation coefficient = 0 or p ≥ 0.05. Neighborhood features were ordered by hierarchical clustering with the Ward method.

