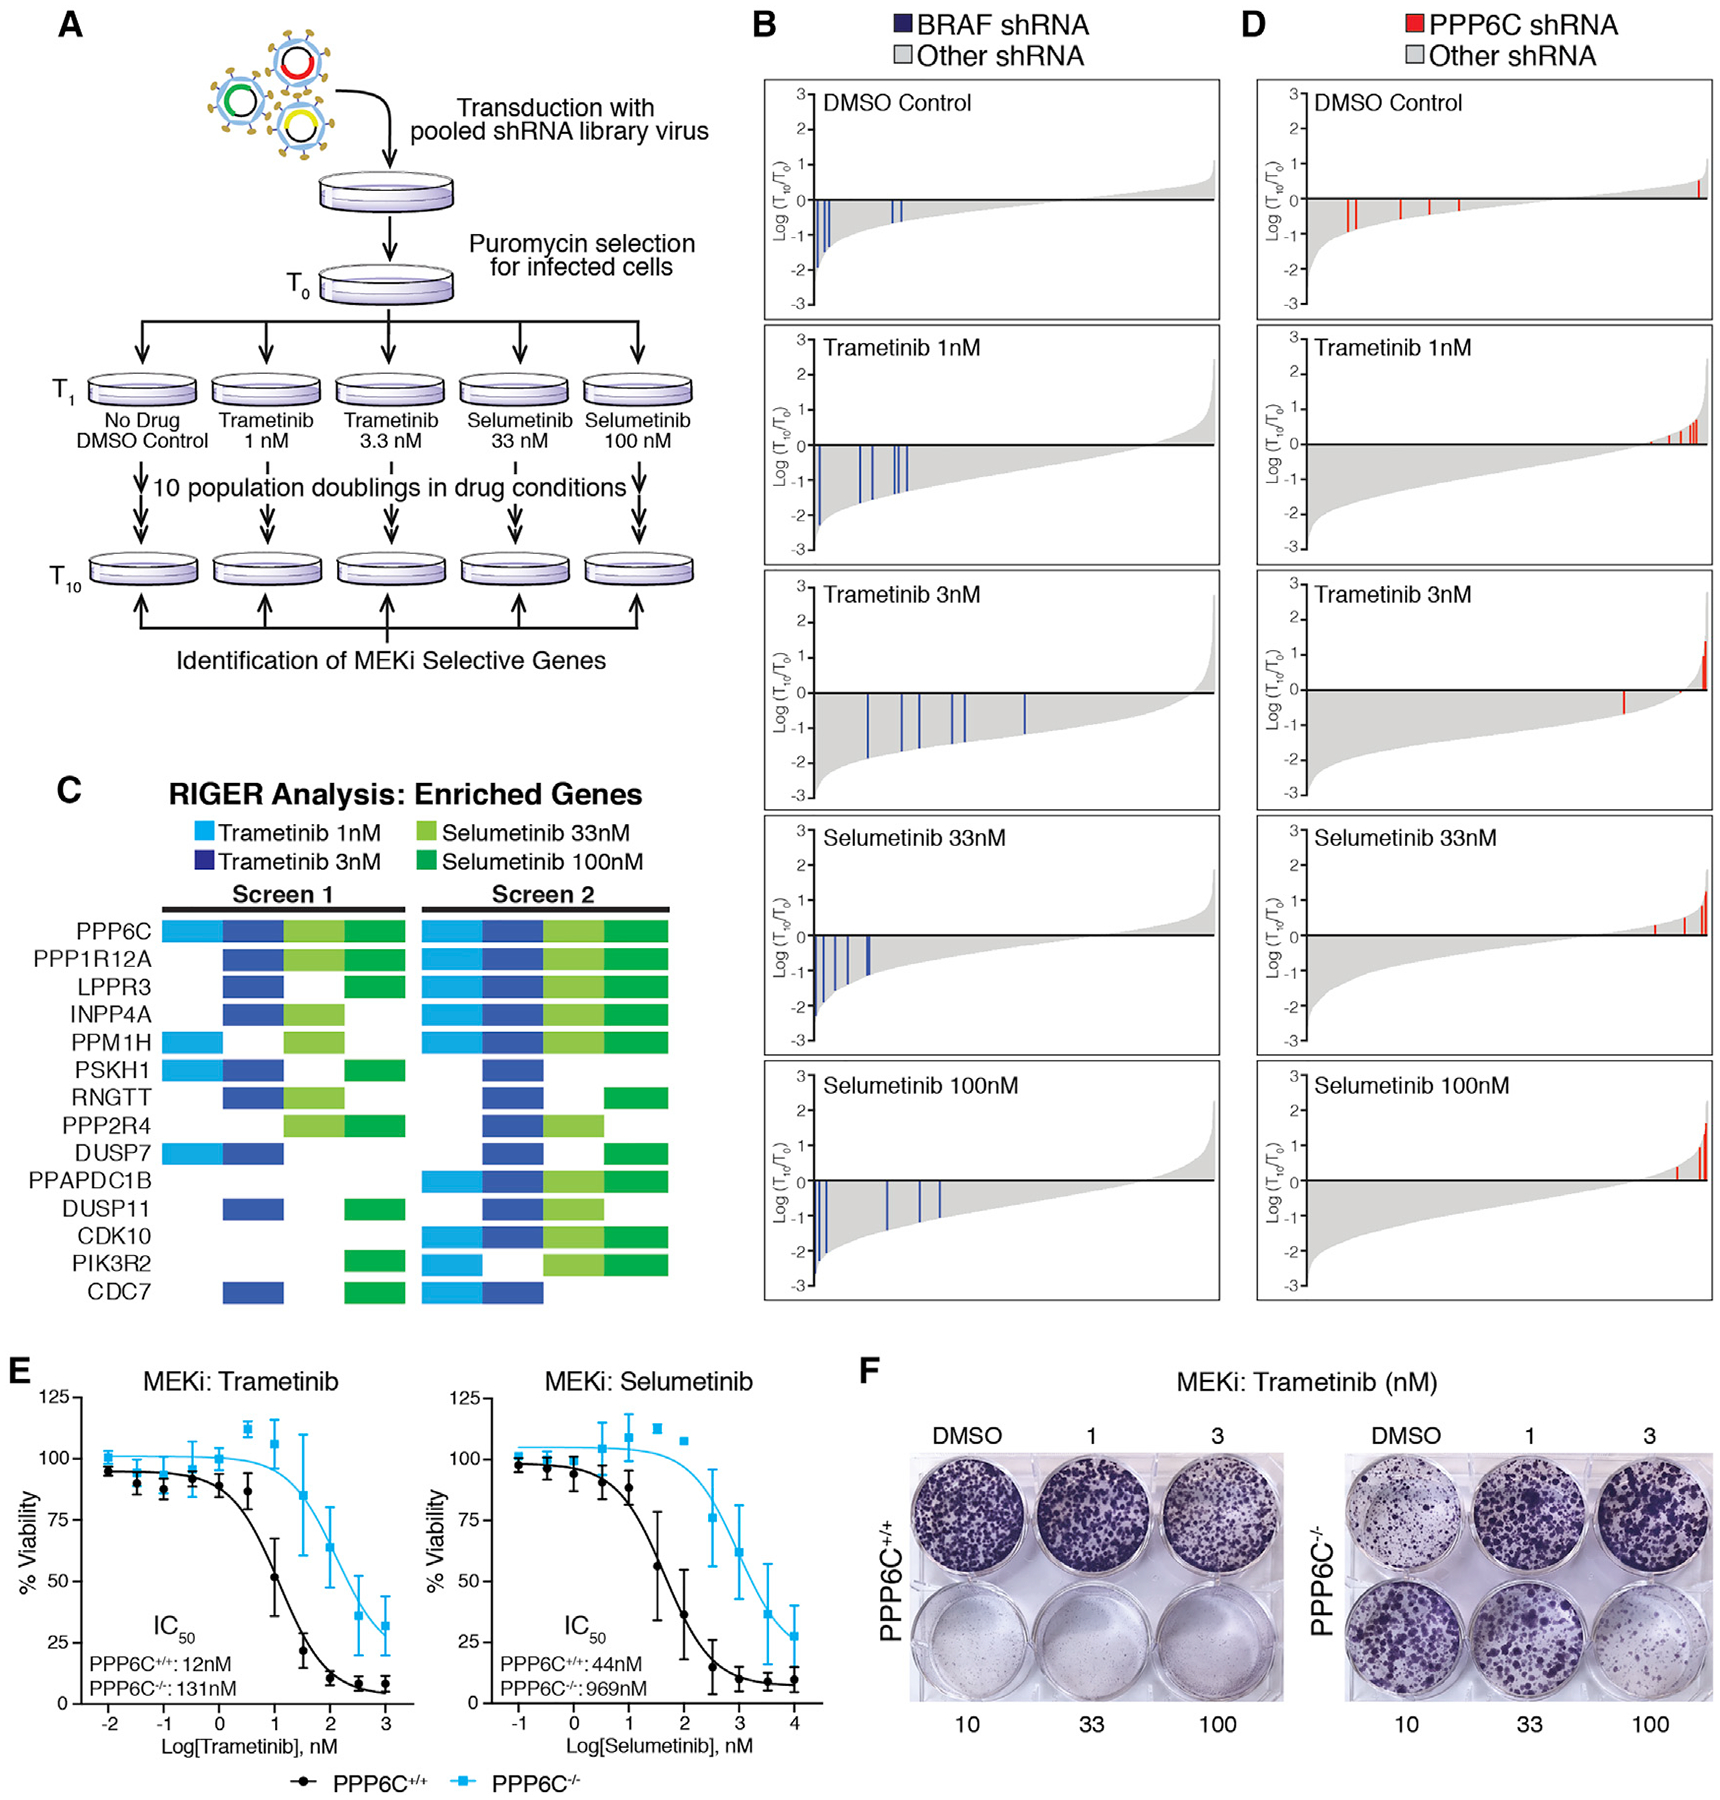
Figure 1. Pooled shRNA library screen identifies PPP6C as a mediator of response to MEKi.

(A) Schematic of the pooled shRNA MEKi sensitivity screen.
(B) Changes in all shRNA hairpins shown as log2(T10/T0) from most depleted to most enriched for each drug condition. Bars representing shRNA hairpins targeting BRAF are shown in blue. All others are shown in gray.
(C) Top enriched genes for each drug condition from two replicates of the screen. Colored boxes indicate the genes ranked in the top 50 enriched genes by RIGER for that drug condition not found in the DMSO control condition.
(D) Changes in all shRNA hairpins shown as log2(T10/T0) arranged as in (B) but with red bars indicating shRNA hairpins targeting PPP6C. Ranking of each hairpin is shown in Figure S1A.
(E) PPP6C+/+ and PPP6C−/− 501mel cells were treated for 72 h with increasing concentrations of trametinib or selumetinib. Cell viability was determined and normalized to vehicle control for each cell line. Dose-response curves and IC50 values for PPP6C+/+ (black) and PPP6C−/− (blue) are shown. The 95% confidence intervals (n = 3) were 8.9–17 nM (PPP6C+/+, trametinib), 65–209 nM (PPP6C−/−, trametinib), 30–66 nM (PPP6C+/+, selumetinib), and 500–1,900 nM (PPP6C−/−, selumetinib). Error bars show SD.
(F) PPP6C+/+ and PPP6C−/− 501mel cells were cultured in media containing DMSO or the indicated concentration of trametinib for 2 weeks and stained with crystal violet. Quantification is shown in Figure S2A. n = 3.
See also Figures S1B, S2B, and S2C.
