
Figure 3. PPP6C regulation of ERK signaling is prominent in ERK pathway-driven cancer cells.
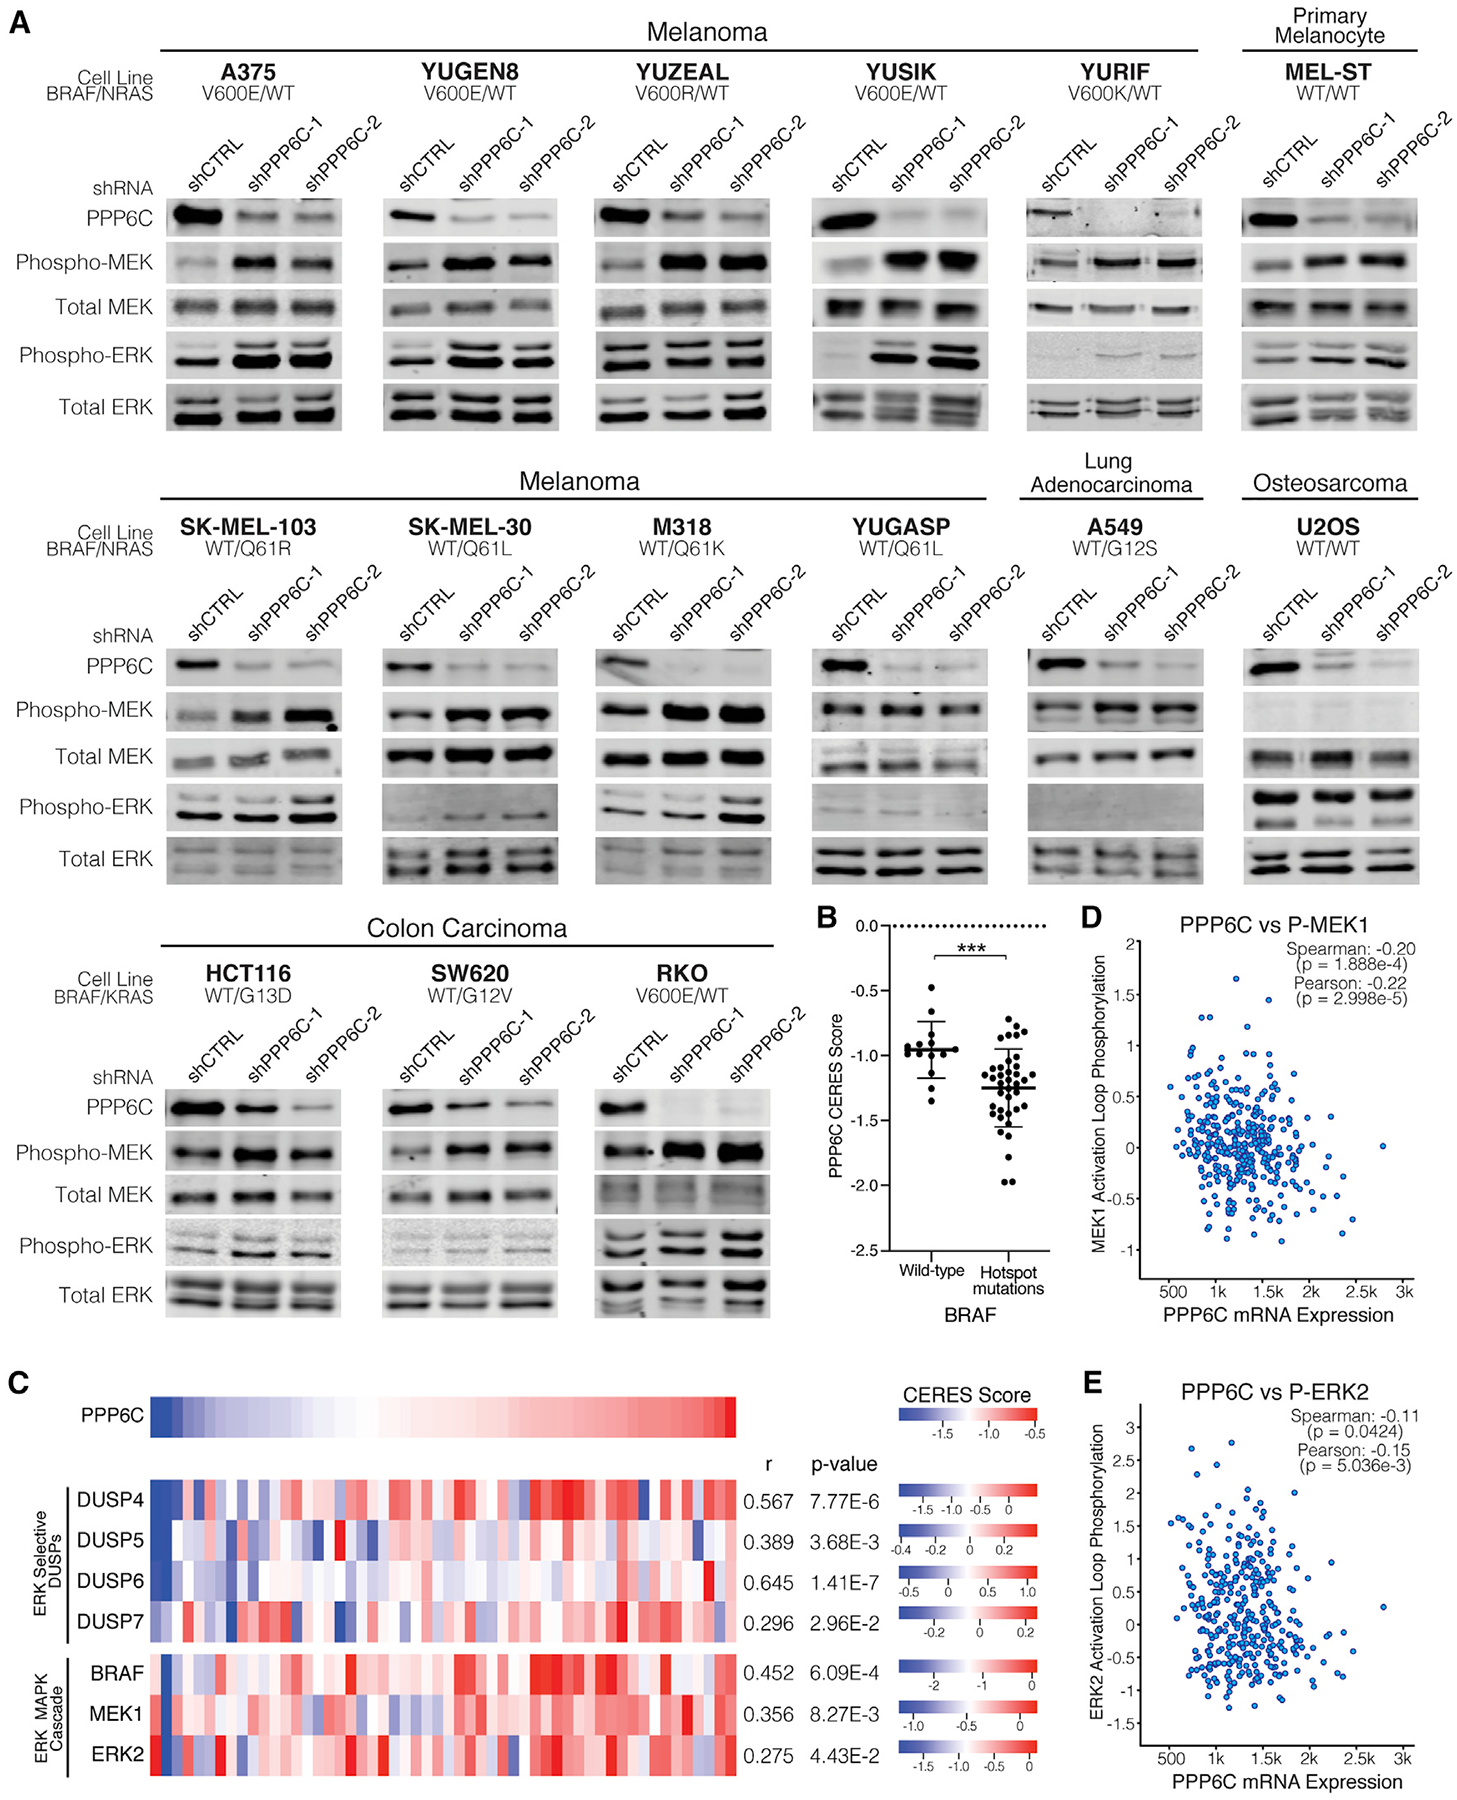
(A) The indicated cell lines were transduced to stably express control (shCTRL) or PPP6C-targeting (shPPP6C-1 or PPP6C-2) shRNAs. Cells were lysed and assessed by immunoblot for levels of phosphorylated and total MEK and ERK. Quantification is shown in Figure S3. n ≥ 2.
(B) PPP6C CERES scores for skin cancer cell lines with WT BRAF or hotspot BRAF mutations from the Cancer Dependency Map Project. Cell lines harboring BRAF variants of unknown significance were excluded. Data are represented as mean ± SD. ***p < 0.0005, Welch’s t test.
(C) Heatmaps depicting CERES scores of PPP6C, ERK-selective DUSPs, and ERK MAPK cascade components in skin cancer cell lines using data from the Cancer Dependency Map Project. Pearson’s correlation coefficients and p values from linear regression analysis of each gene with PPP6C in the DepMap portal are listed.
(D) PPP6C RNA-seq mRNA expression level plotted against MEK1 phosphorylation levels for TCGA tumor samples in cBioPortal. Correlation coefficients and associated p values from linear regression analyses are indicated.
(E) PPP6C mRNA levels plotted against ERK2 phosphorylation levels for TCGA tumor samples as in (D).
See also Figure S4.