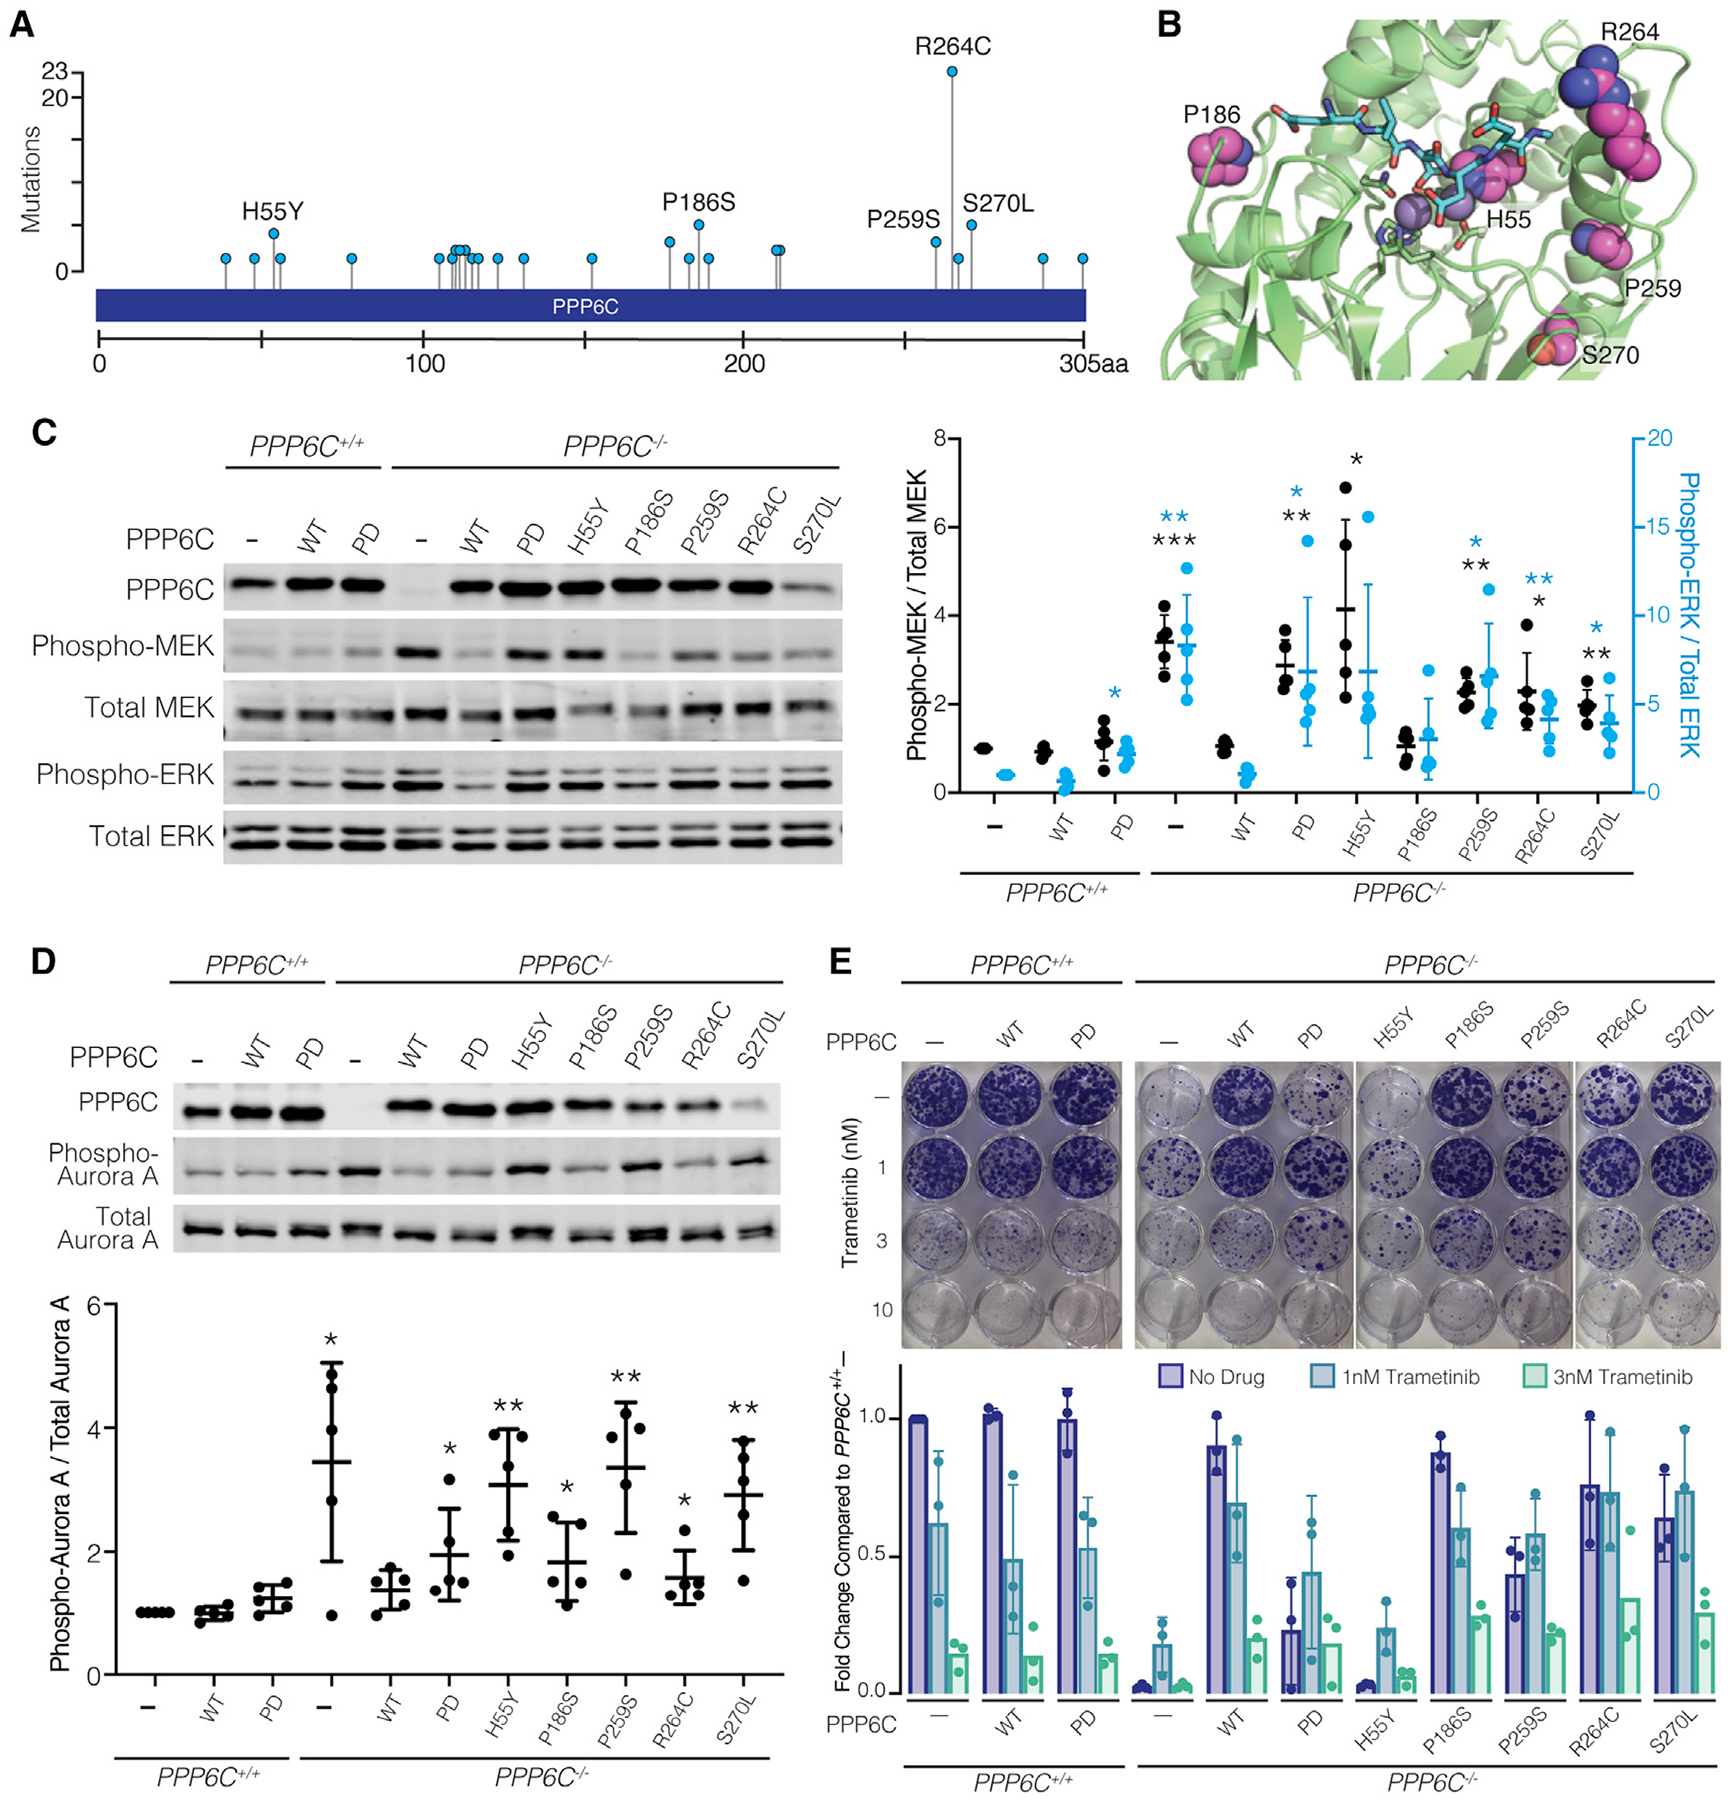
Figure 6. Cancer-associated PPP6C mutations decrease phosphatase activity against MEK1/2.

(A) Frequencies of PPP6C mutations reported in melanomas. Data are from nonoverlapping melanoma studies in cBioportal (Cerami et al., 2012; Gao et al., 2013).
(B) PPP6C residues mutated in cancer are shown in spacefill representation modeled on the X-ray crystal structure of PPP5C in complex with a peptide substrate (PDB: 5HPE). Bound peptide (cyan) and catalytic metal ions (gray spheres) are shown.
(C) PPP6C+/+ and PPP6C−/− 501mel cells were transduced to stably express GFP (–), WT PPP6C, or the indicated PPP6C mutants. Cells were lysed and assessed by immunoblot for phosphorylated and total MEK and ERK. Phospho/Total MEK (black) and ERK (blue) signal ratios were quantified and normalized to the GFP-expressing PPP6C+/+ samples. Mean values ± SD are shown, n = 5. Significance is shown in comparison to PPP6C+/+ cells expressing GFP. *p < 0.05, **p < 0.01, ***p < 0.001, paired t test.
(D) Cells from (C) were treated with 100 ng/mL nocodazole for 24 h. Mitotic cells were lysed and assessed by immunoblot for phosphorylated and total Aurora A. Phospho-Aurora A/Total Aurora A signal ratios were quantified (n = 5) and significance determined as in (C). *p < 0.05, **p < 0.01, paired t test.
(E) Cells from (C) were cultured in media containing DMSO vehicle alone or the indicated trametinib concentration for 2 weeks and stained with crystal violet. Clonogenic growth was analyzed by ColonyArea in ImageJ and normalized to GFP-expressing PPP6C+/+ samples, n = 3.
