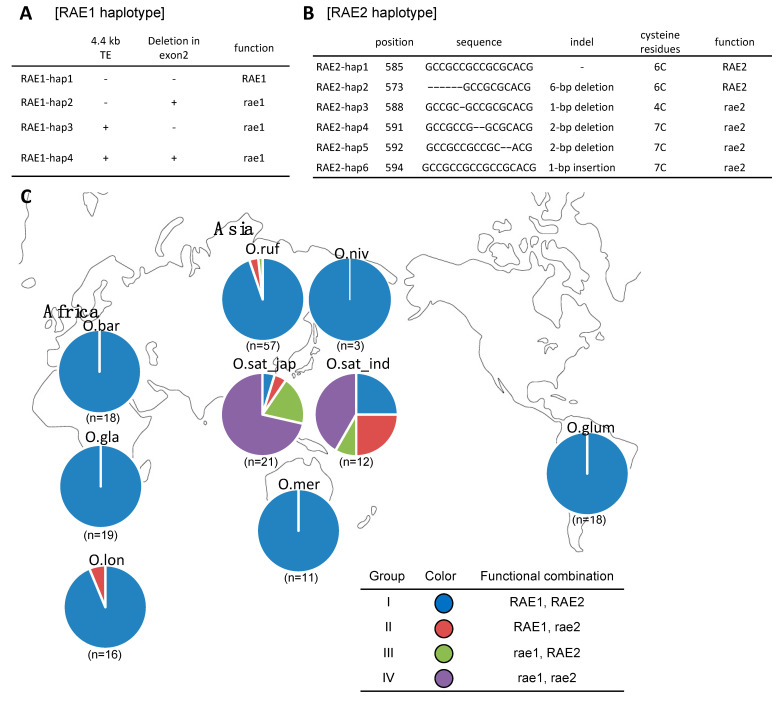
Figure 5.
Frequency of the combination of RAE1 and RAE2 haplotypes. (A,B) Haplotypes in RAE1 (A) and RAE2 (B) categorized based on the comparison between O. rufipogon and O. sativa ssp. japonica/indica. (C) Combinations of the RAE1 and RAE2 haplotypes among the AA genome species were classified into four groups. The pie chart indicates the percentage of each group, where blue, red, green, and purple indicate groups I, II, III, and IV, respectively. Numbers below the pie charts are the numbers of accessions used for this analysis. Green and orange squares indicate cultivated rice species and their wild progenitors in Africa and Asia, respectively. O.bar, O. barthii; O.gla, O. glaberrima; O.lon, O. longistaminata; O.mer, O. meridionalis; O.glum, O. glumaepatula; O.ruf, O. rufipogon; O.niv, O. nivara; O.sat_jap, O. sativa ssp. japonica; O.sat_ind, O. sativa ssp. indica.

