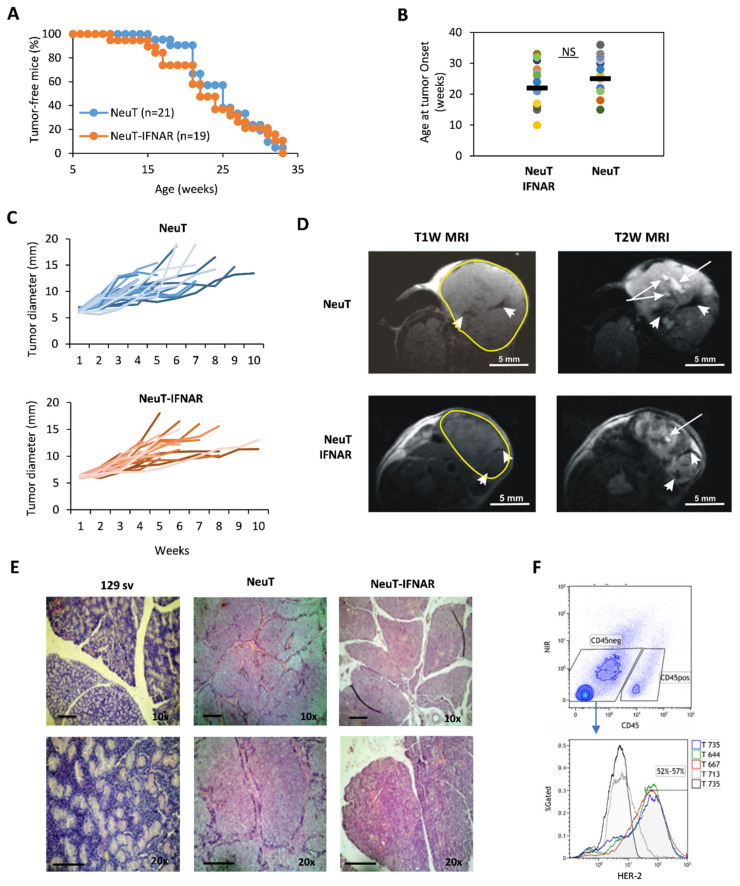
Figure 4.
Characterization of NeuT and NeuT-IFNAR SDC models. (A) Tumor incidence in NeuT (blu line) vs. NeuT-IFNAR (orange line) mice. (B) Age of first tumor occurrence in both mouse strains. (C) Tumor development over time in NeuT (n = 25) and NeuT-IFNAR mice (n = 22). (D) Representative images of axial T1-weighted (T1W) and T2-weighted (T2W) MRI of NeuT and NeuT-IFNAR tumor mass of similar dimensions. White arrows in T2W images indicate necrotic areas; white head arrows in both T1W and T2W MRI indicate hemorrhagic regions. (E) Hematoxylin/Eosin staining of major salivary glands explanted from a naive 129sv and a 33 weeks old transgenic NeuT and NeuT-IFNAR mice. Scale bar: 100 µm (magnification 10× and 20×). (F) Surface staining with anti-c-ErbB2/c-Neu antibody after gating on viable CD45-negative cells in salivary gland tumor cell suspensions from NeuT and NeuT-IFNAR mice. Black-line histogram represents isotype control antibody-stained cells. Grey-line histogram represent staining of salivary gland from non-transgenic 129sv mice.

