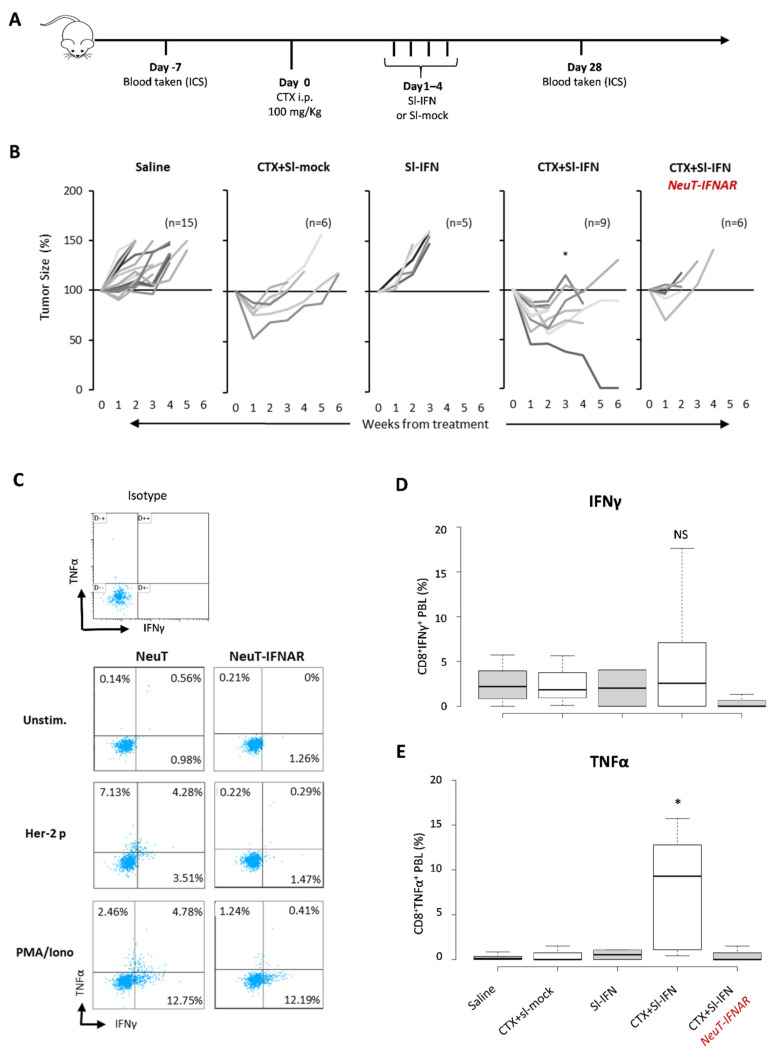
Figure 5.
Therapeutic effect of combined CTX/Sl-IFN treatment in NeuT transgenic mice. (A) Schematic representation of the experimental design. (B) Percentage tumor size in NeuT 129sv mice treated with CTX and Sl-mock (n = 6) or with Sl-IFN (n = 5) or with a combination of CTX and Sl-IFN (n = 9) according to the schedule depicted above. One group of mice was treated with Saline as control (n = 15) and one group of NeuT-IFNAR was treated with CTX + Sl-IFN (n = 6) as specificity control. * p < 0.05 (only at week 3). (C) Representative dot plots showing the percentage of IFNγ+ and/or TNFα+ cells in CD3+ CD8+ T-gated cells from NeuT and NeuT-IFNAR mice treated with CTX and Sl-IFN. Blood samples were collected 28 days after treatment. Unstimulated, Her-2/Neu peptide-stimulated and PMA/Iono-stimulated PBL samples were stained and analyzed as described in Section 2. One representative dot plot from an isotype-stained control is also shown. (D) Box-Whisker plots depicting the percentage of IFNγ+CD8+ T lymphocytes and (E) the percentage of TNFα+CD8+T lymphocytes in the blood of mice treated as indicated after stimulation with Her-2/Neu peptide (435–443). Center lines show the medians; box limits indicate the 25th and 75th percentiles as determined by R software; whiskers extend 1.5 times the interquartile range from the 25th and 75th percentiles (n = 5).

