Figure 6.
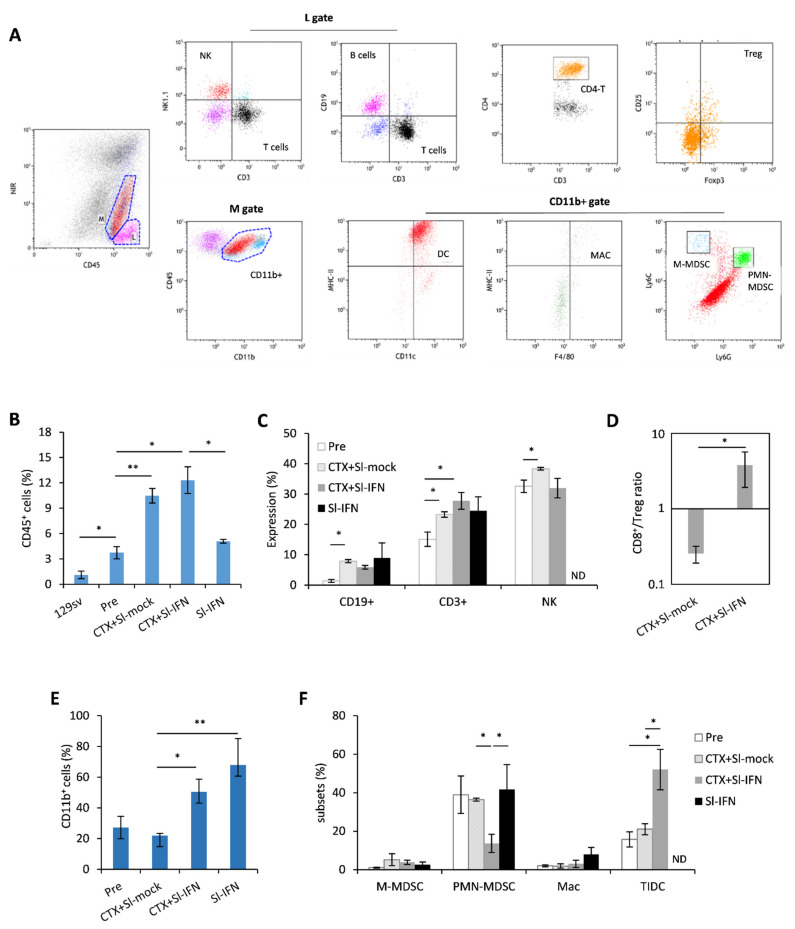
Analysis of leucocyte subsets in the tumor mass 22 days after treatment. (A) Representative dot plots of the gating strategy for lymphoid and myeloid subsets in tumor cell suspensions. (B) Percentage of CD45+ tumor-infiltrating cells in the tumor mass of NeuT 129sv mice treated with CTX and Sl-mock or Sl-IFN or with Sl-IFN alone as detailed in Section 2 (n = 4). (C) Percentage of the indicated lymphoid subsets in the tumor mass after gating on CD45+ SSClo cells. (D) CD8+ T/Treg ratio in the tumor. (E) Percentage of CD11b+ after gating on viable CD45+ cells, and of (F) tumor-infiltrating myeloid cell subsets. Myeloid subsets percentage is calculated after gating on CD11b+ cells. * p < 0.05; ** p < 0.01. ND, Not determined.

