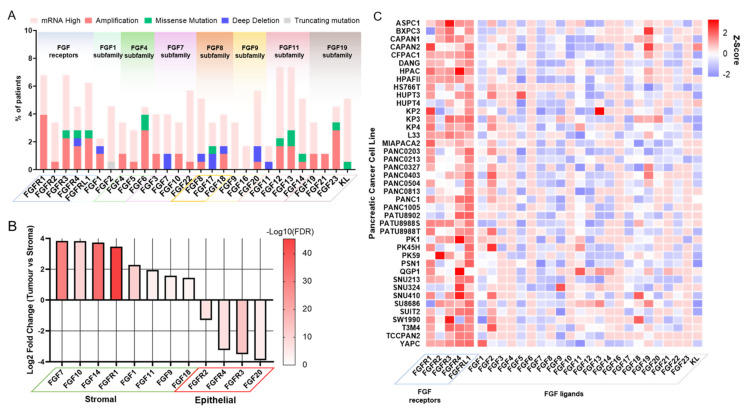
Figure 4.
FGF/FGFR expression in PDAC patients and cell lines. (A) Mutation and expression data of FGF related genes from pancreatic tumours from TCGA cohort (n = 177). Data of mutations and expression were generated using cBioPortal [58], where mRNA high was assigned to a Z-score > 2. (B) Significantly enriched FGF related genes from differential analysis results using DESeq2 [59] comparing microdissections of pancreatic tumour epithelial tissue compared to tumour stromal tissue. Positive Log2 fold change indicates higher expression in stromal tissue compared to tumour epithelial tissue and vice versa. The -Log10 transform of the false discovery rate (FDR) is used to show statistical significance. Data were obtained from GSE93326 [60]. (C) Gene expression heatmap of FGF related genes in pancreatic cancer cell lines from the Cancer Cell Line Encyclopaedia [61]. The Z-scores were calculated using the mean and standard deviation of all genes.

