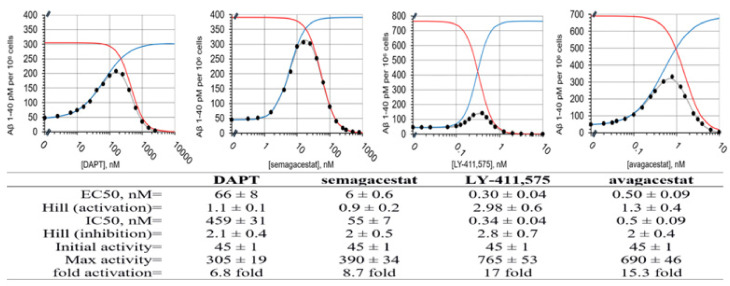
Figure 1.
Dose-response curves for Aβ 1-40 production in SH-SY5 cells in the presence of DAPT, semagacestat, LY-411,575, and avagacestat. The Aβ 1-40 production in the SH-SY5 cells shows biphasic activation–inhibition dose-response curves with all four drugs (●). The different parameters that describe the biphasic dose-response curves were calculated and listed in the table (methods, Equation (1)) [11]. The gray lines represent the best-fit curve to the experimental values (●). The blue and red lines represent calculated activation and inhibition events if the two events can be separated (methods, Equation (1)). The activation constants (EC50) and the inhibition constant (IC50) represent the affinity for each binding event. The Hill's coefficients represent the stoichiometry of the interaction, and/or possible cooperative processes in the binding events. The ‘Max activity’ parameter represents the maximal possible activation if there is no competing inhibition. The ‘Max activity’ parameter correlates with the ability of drugs to facilitate enzyme–substrate interactions [11]. The initial activity is the same for all four drugs, because all of the measurements used the same batch of cells.

