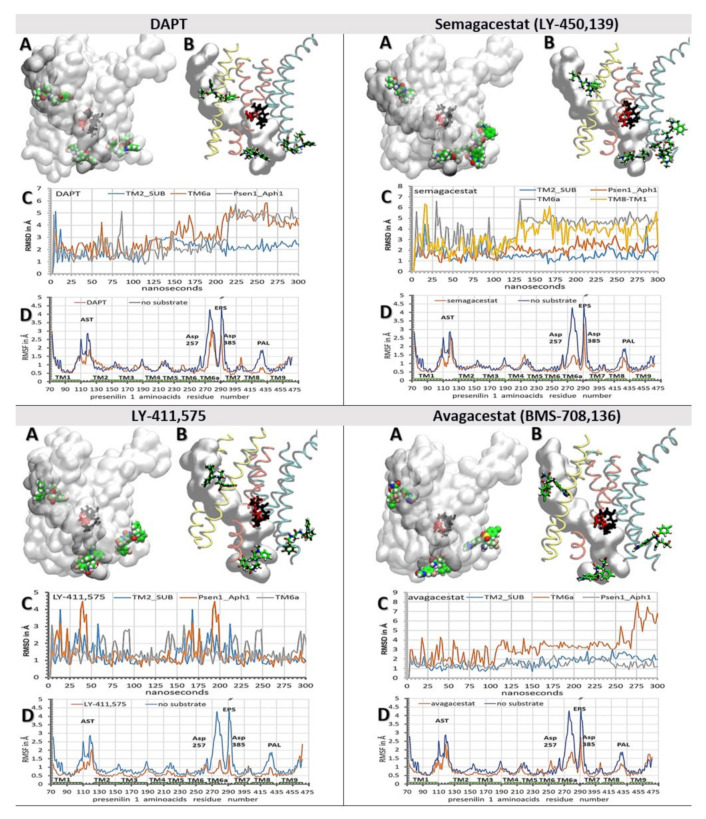
Figure 5.
(A–D) Binding interactions between the biphasic drugs and γ-secretase in a complex with its substrate (PDB: 6IYC) [38]. The all-atom molecular dynamic studies [51] started with γ-secretase in a complex with different biphasic drugs from the molecular docking calculations (Figure 4) [48]. (A,B) Different drugs can bind to different sites next to the substrate. The presenilin structures are shown as transparent surfaces. Buried under the surface in the active site tunnel are the substrate (gray surfaces), the active site Asp 257 and Asp 385 (red licorice), and the PAL motif (black licorice, Pro 435, Ala 434, Leu 433). The drug molecules are shown as: carbon, green; oxygen, red; nitrogen, blue; fluorine and chlorine, pink, in order to make the structures underneath the surface visible. (B) TM2 and TM3 are shown in yellow; TM6, TM6a, and TM7 are shown in orange; TM8, TM9, and TM1 are shown in cyan. (C) RMSD values for the drugs bound at different sites are shown as a function of the simulated molecular time [51]. The steep increases in the RMSD values indicate the sliding of the drugs in the binding sites, while the fluctuations in the RMSD values indicate the relative mobility of the drugs in their binding sites. (D) The RMSF values for the individual amino acids show how the drugs can decrease the protein mobility at different sites [40,41]. Different structural elements are mapped on the graph: TM1-TM9, Trans-Membrane helix 1 to 9; AST, membrane-embedded opening of the Active Site Tunnel; EPS, Endo-Proteolytic Site; PAL motif (Pro 435, Ala 434, Leu 433) [42], and Asp 257 and Asp 385 in the active site.

