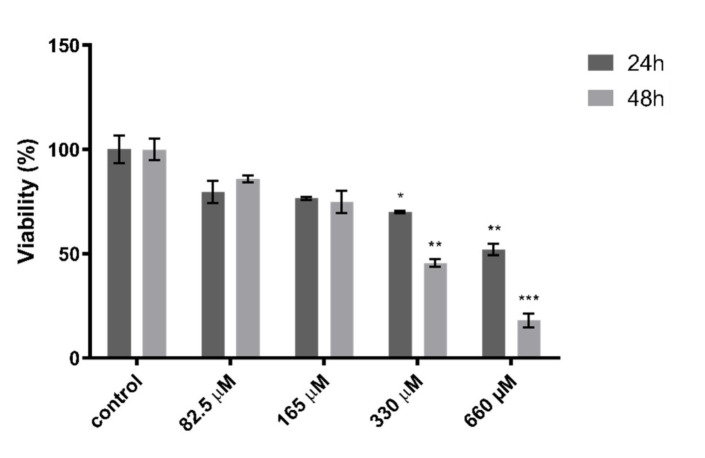
Figure 1.
Effect of quercetin on HepG2 cells viability. Cells were treated with Quercetin at concentrations of 82.5, 165, 330, and 660 μM for 24 and 48 h. Data are expressed as a percentage of the control group ± the standard error of the mean of three replicates from three independent experiments. Statistical significance was assessed by multiple t test followed by Holm–Sidak correction for multiple comparisons; * p < 0.05, ** p < 0.01, *** p < 0.001.

