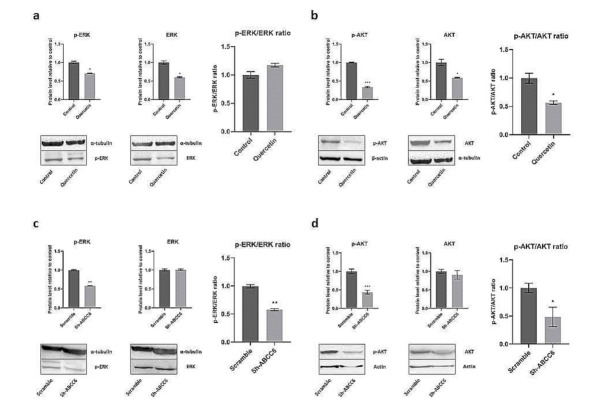
Figure 6.
Effect of Quercetin treatment (a,b) or ABCC6 silencing (c,d) on phosphorylated AKT and ERK. The ratios between phosphorylated and total ERK (a,c) and between phosphorylated and total AKT (b,d) were determined by comparing the intensities of the immunoreactive bands obtained by using specific antibodies. Cells treated with DMSO 0.25% or scrambled sh-RNA were used as controls for HepG2 cells treated with Quercetin and subjected to ABCC6 knockdown, respectively. α-tubulin or β-actin were used as a loading control. Data are presented as the mean and the standard error of the mean of three independent experiments. Results were analyzed by Student’s t test; * p < 0.05; ** p < 0.01; *** p < 0.001.

