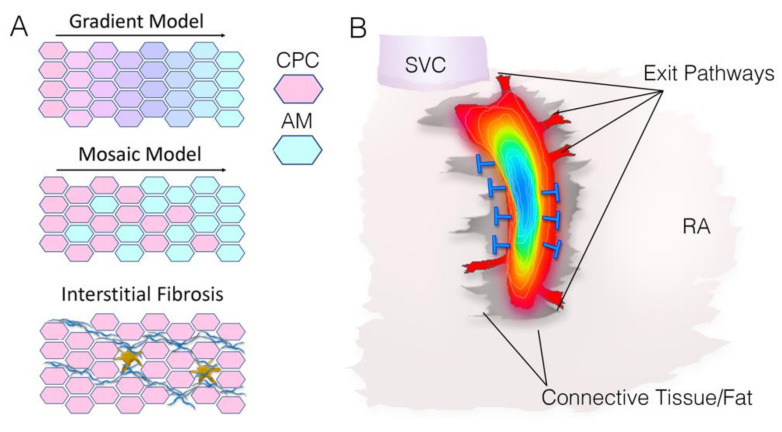
Figure 2.
Models of sinoatrial node structure/function. (A) Graphical depictions of the Gradient Model, the Mosaic Model, and Interstitial Fibrosis. CPC—cardiac pacemaker cell, AM—atrial myocyte. (B) Diagram of sinoatrial node activation pattern (blue to red). Potential exit pathways to the atrial myocardium and connective tissue (grey) that serve as resistive barriers (blue lines) are indicated. SVC—superior vena cava, RA—right atrium.

