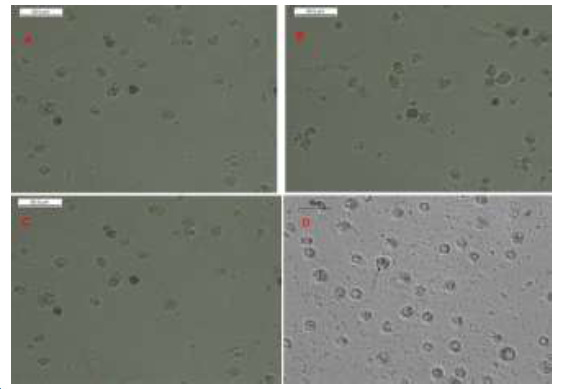
Fig. 1.

Light microscopy imaging. Cancer cells in different study groups. (A) Control cells showing highly proliferative viable control untreated cancer cells. (B) Less proliferative and less viable treated cancer cells with Nisin, (C) Less proliferative and less viable treated cancer cells with Thioridazine (D) Less proliferative and less viable treated cancer cells with Nisin and Thioridazine (black arrow).
