
Fig. 1.
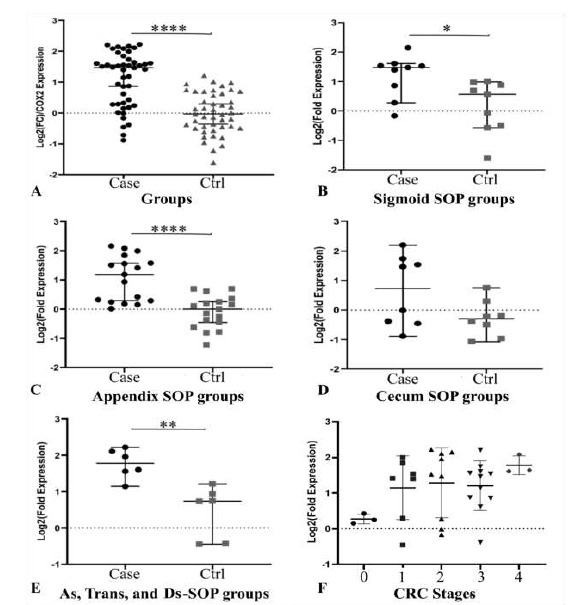
Comparison of COX-2 expression in patient and control groups, and cases stages of cancer. A) The Cox-2 is significantly overexpressed in the tumor samples in general (p< 0.0001) in individual chart. B) The sigmoid primary site's COX-2 expression is significantly higher (p= 0.0188). C) There is highly significant COX-2 overexpression in Appendix tumor group compare to Appendix control (p< 0.0001). D) The cecum primary site's p-value is 0.1605. E) The p-value of the samples that were located from ascending, transverse and descending (As, Trans, and Ds) colon is 0.0043 that represent highly significant differences. F) Increase of COX-2 expression due to increase of stages is observable but it is not statistically significant.