
Fig. 3.
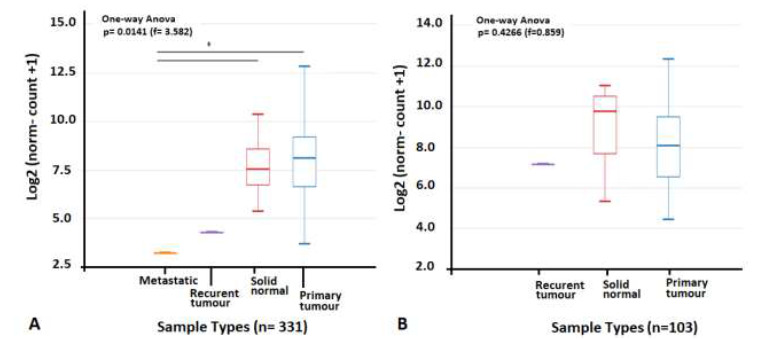
The PTGS2 expression comparison of TCGA-COAD, -READ and normal solid tissues. A) PTGS2 expression of TCGA-COAD-primary tumor and TCGA-Solid Normal Tissues were not any significant differences; the metastatic sample (n= 1) showed significant lower expression compare to the other 2 groups. B) PTGS2 expression of TCGA-READ and TCGA-Solid Normal Tissues does not show significant differences.