
Fig. 4.
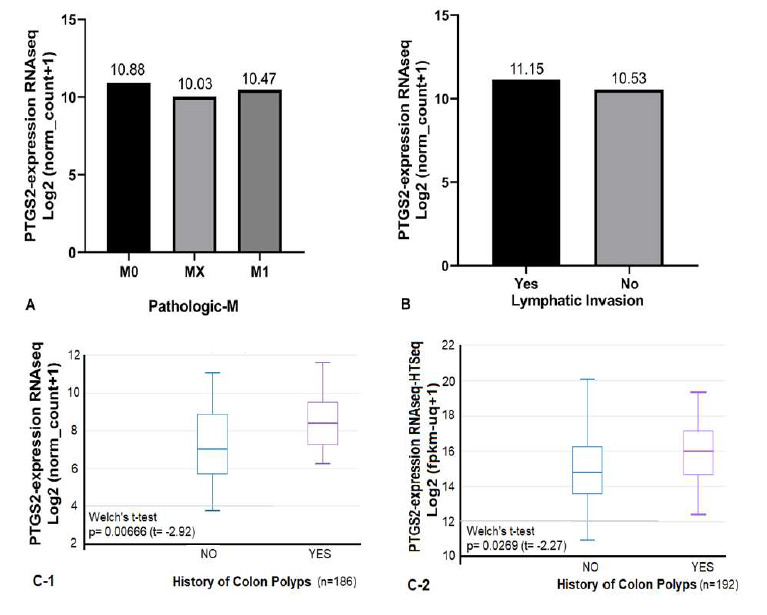
Correlation of PTGS2 expression with pathological features in TCGA-COAD and –READ. A) Among 1519 samples, the PTGS2 expression did not represent any significant correlation with Pathologic-M feature. B) The PTGS2 expression in lymphatic invasive group is close to the non-invasive one. C) The TCGA-READ datasets showed significant higher PTGS2 expression in group with the history of colon polyps.