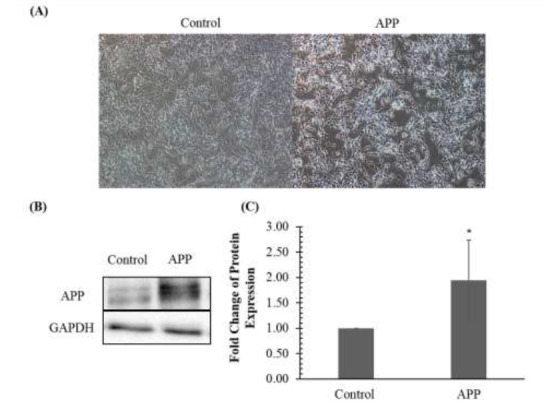
Fig. 1.

Amyloid precursor protein (APP) expression in SH-SY5Y cells following transduction. (A). Micrographs of SHSY5Y cells transduced with control and APP overexpression vector. Magnification, ×100. (B) APP expression validation in SH-SY5Y cells transduced with the control vector and APP by immunoblotting. (C) Fold change of protein expression in SH-SY5Y cells transduced with control vector and APP vector determined by densitometry. The bar chart shows the mean values of protein expression with ± standard deviation. * denotes that the P-value is less than 0.05 as compared to the control.
