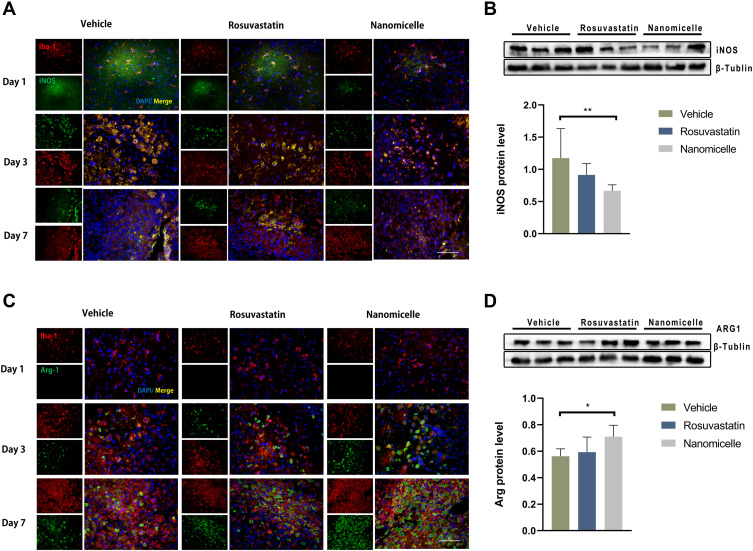
Figure 7.
The effects of nanomicelle on Microglia/macrophages polarization. (A) Immunofluorescence staining of iNOS+Iba-1+ around the hematoma border zone. (B) Western blot analysis of iNOS protein. (C) Immunofluorescence staining of Arg-1+Iba-1+ around the hematoma border zone. (D) Western blot analysis of iNOS protein. Scale bar =100μm. Data are mean ± SD, n = 6 mice per group, *P < 0.05, **P<0.01.

