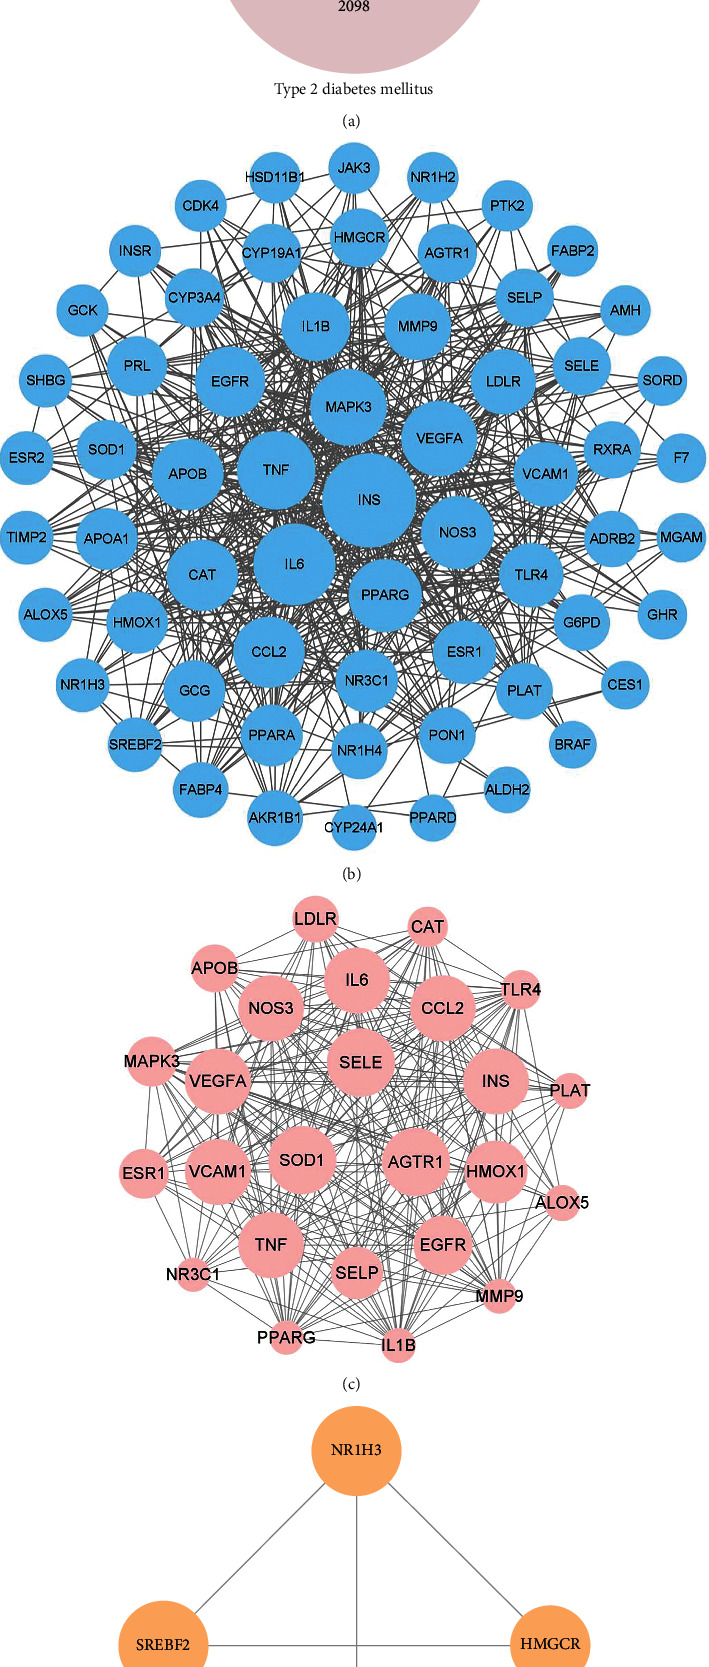
Figure 1.

(a) Venn diagram representing the gene targets among Gegen, T2DM, and hyperlipidemia. (b) PPI network of common targets among Gegen, T2DM, and hyperlipidemia, containing 63 nodes and 538 edges. Each node represents a protein produced by a single protein-coding gene locus. An edge represents the interaction between proteins. The greater the number of edges connected to the same node (namely, the greater the degree), the larger the size of the node. (c) Module of the PPI network with the highest score (module 1), containing 25 nodes and 232 edges. (d) Module of the PPI network with the second highest score (module 2), containing 4 nodes and 6 edges. The higher the MCODE score of the node, the larger the size of the node. The MCODE score reflects the density of the node and surrounding nodes. Abbreviations: T2DM, type 2 diabetes mellitus; PPI, protein-protein interaction.
