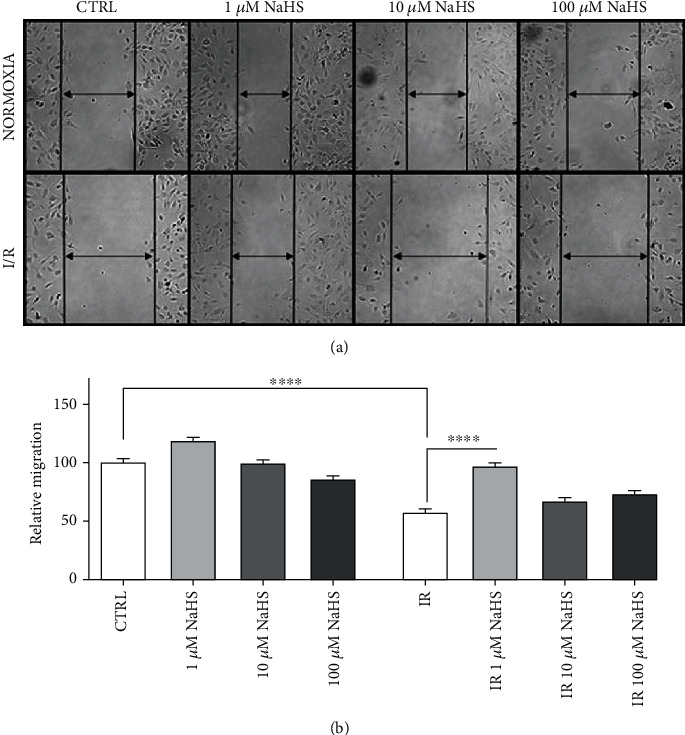
Figure 2.

(a) Representative images of cells after 6 hours in the different experimental conditions. (b) Relative migration, all data sets were normalized on the normoxic control condition (CTRL). Statistical significance: ∗∗∗∗p < 0.0001.

(a) Representative images of cells after 6 hours in the different experimental conditions. (b) Relative migration, all data sets were normalized on the normoxic control condition (CTRL). Statistical significance: ∗∗∗∗p < 0.0001.