
Figure 4.
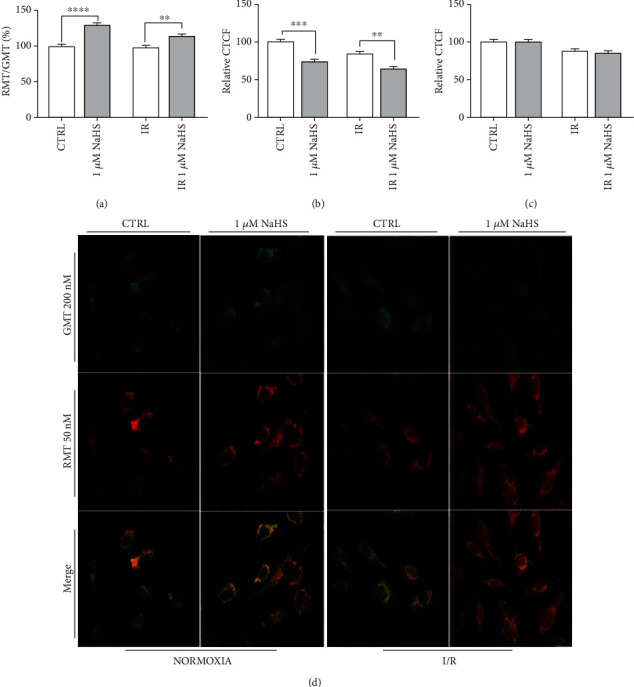
(a) Ratio between red (RMT) and green (GMT) MitoTracker™; (b, c) GMT and RMT fluorescence, respectively, calculated for each experimental condition as a percentage of CTRL; (d) representative fields of stained cells. All data sets were normalized on the normoxic control condition (CTRL). Statistical significance: ∗∗p < 0.01, ∗∗∗p < 0.001, and ∗∗∗∗p < 0.0001.