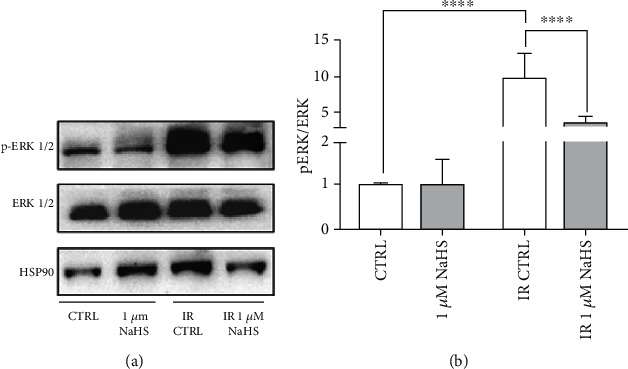
Figure 5.

(a) Representative experiment of ERK1/2 and p-ERK1/2; (b) ratio of p-ERK on total ERK (n = 4). Both total and phosphorylated proteins were first normalized on the loading control (HSP90), and then, the ratio was calculated. All data sets were normalized on the normoxic control condition (CTRL). Statistical significance: ∗∗∗∗p < 0.0001.
