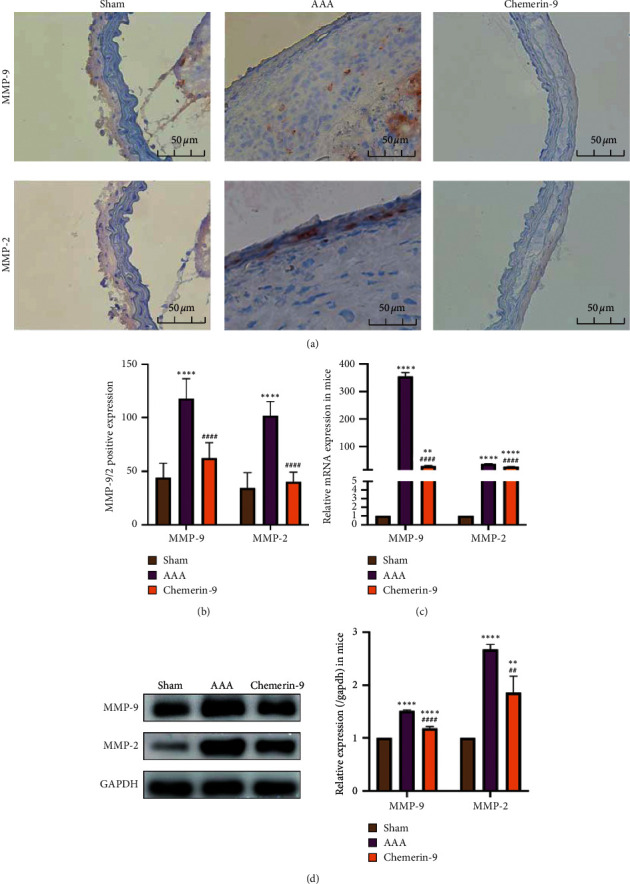
Figure 6.

Effects of chemerin-9 on matrix metalloproteinase (MMP)-2 and MMP-9 expression in ApoE−/− mice. (a) Representative IHC staining images of MMP-9 and MMP-2 in 3 groups. (b) Semiquantitative analysis of positive expression of MMP-9 and MMP-2 in 3 groups (n = 6/group). (c) Relative mRNA expression of MMP-9 and MMP-2 in the mice aortas (n = 6/group). (d) Representative western blot images (left) and semiquantitative analysis (right) of protein expression of MMP-9 and MMP-2 in 3 groups (n = 6/group). The data are shown as mean ± SD. ∗∗P < 0.01, ∗∗∗∗P < 0.0001 vs. the Sham group. ##P < 0.01, ####P < 0.0001 vs. the AAA group.
