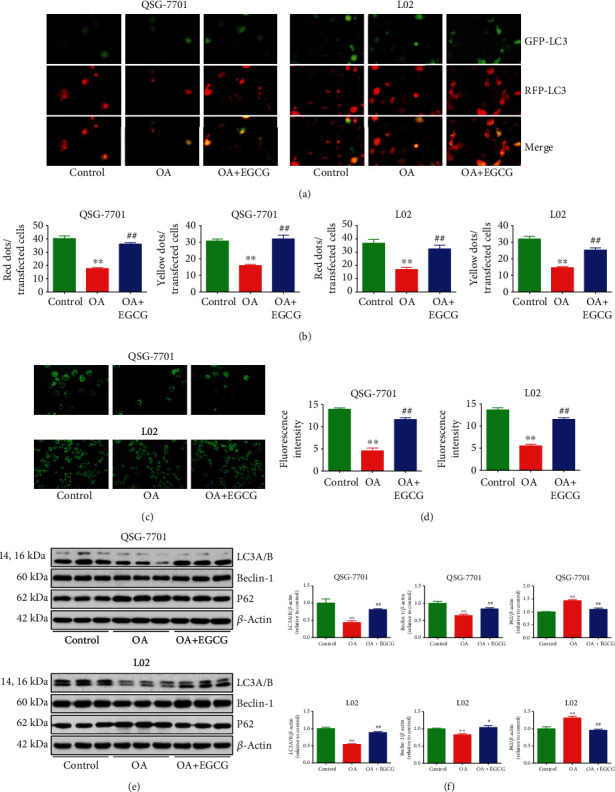
Figure 4.

Effects of EGCG on the autophagy of OA-treated QSG-7701 and L02 cells. (a) GFP-RFP-LC3-transfected QSG-7701 and L02 cells were examined by fluorescence microscopy; original magnification ×1000. (b) The ratios of red and yellow dots to transfected cells were calculated. (c) Representative photographs of MDC staining. (d) The fluorescence intensity was analyzed. (e) Western blot analysis for the expression levels of LC3A/B, beclin-1, and P62 in each group. β-Actin was used as the loading control. (f) The densitometry analysis of each factor was performed in each group, normalized to the corresponding β-actin level. Data are presented as mean ± SEM of three independent experiments; ∗∗P < 0.01 compared with the control group; #P < 0.05, ##P < 0.01 compared with the OA group.
