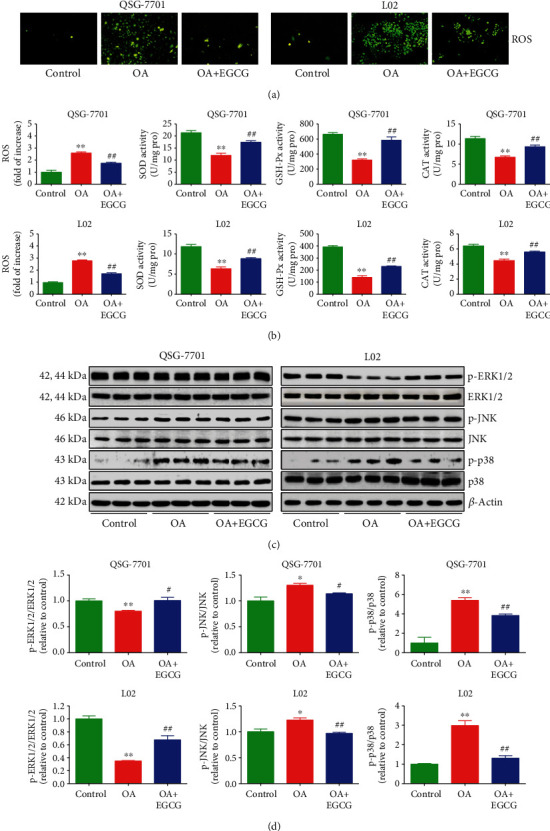
Figure 5.

Effects of EGCG on the ROS/MAPK signaling pathway in OA-treated QSG-7701 and L02 cells. (a) The intracellular ROS production was detected using the fluorescent probe DCF-DA (shown in green; original magnification, ×400). (b) The intracellular ROS production and the activities of SOD, GSH-Px, and CAT were measured. (c) The protein expressions of ERK1/2, p-ERK1/2, JNK, p-JNK, p38, and p-p38 were analyzed by Western blot. β-Actin was used as the loading control. (d) The densitometry analysis of each factor was performed in each group, normalized to the corresponding β-actin level. Data are presented as mean ± SEM of three independent experiments; ∗P < 0.05, ∗∗P < 0.01 compared with the control group; #P < 0.05, ##P < 0.01 compared with the OA group.
