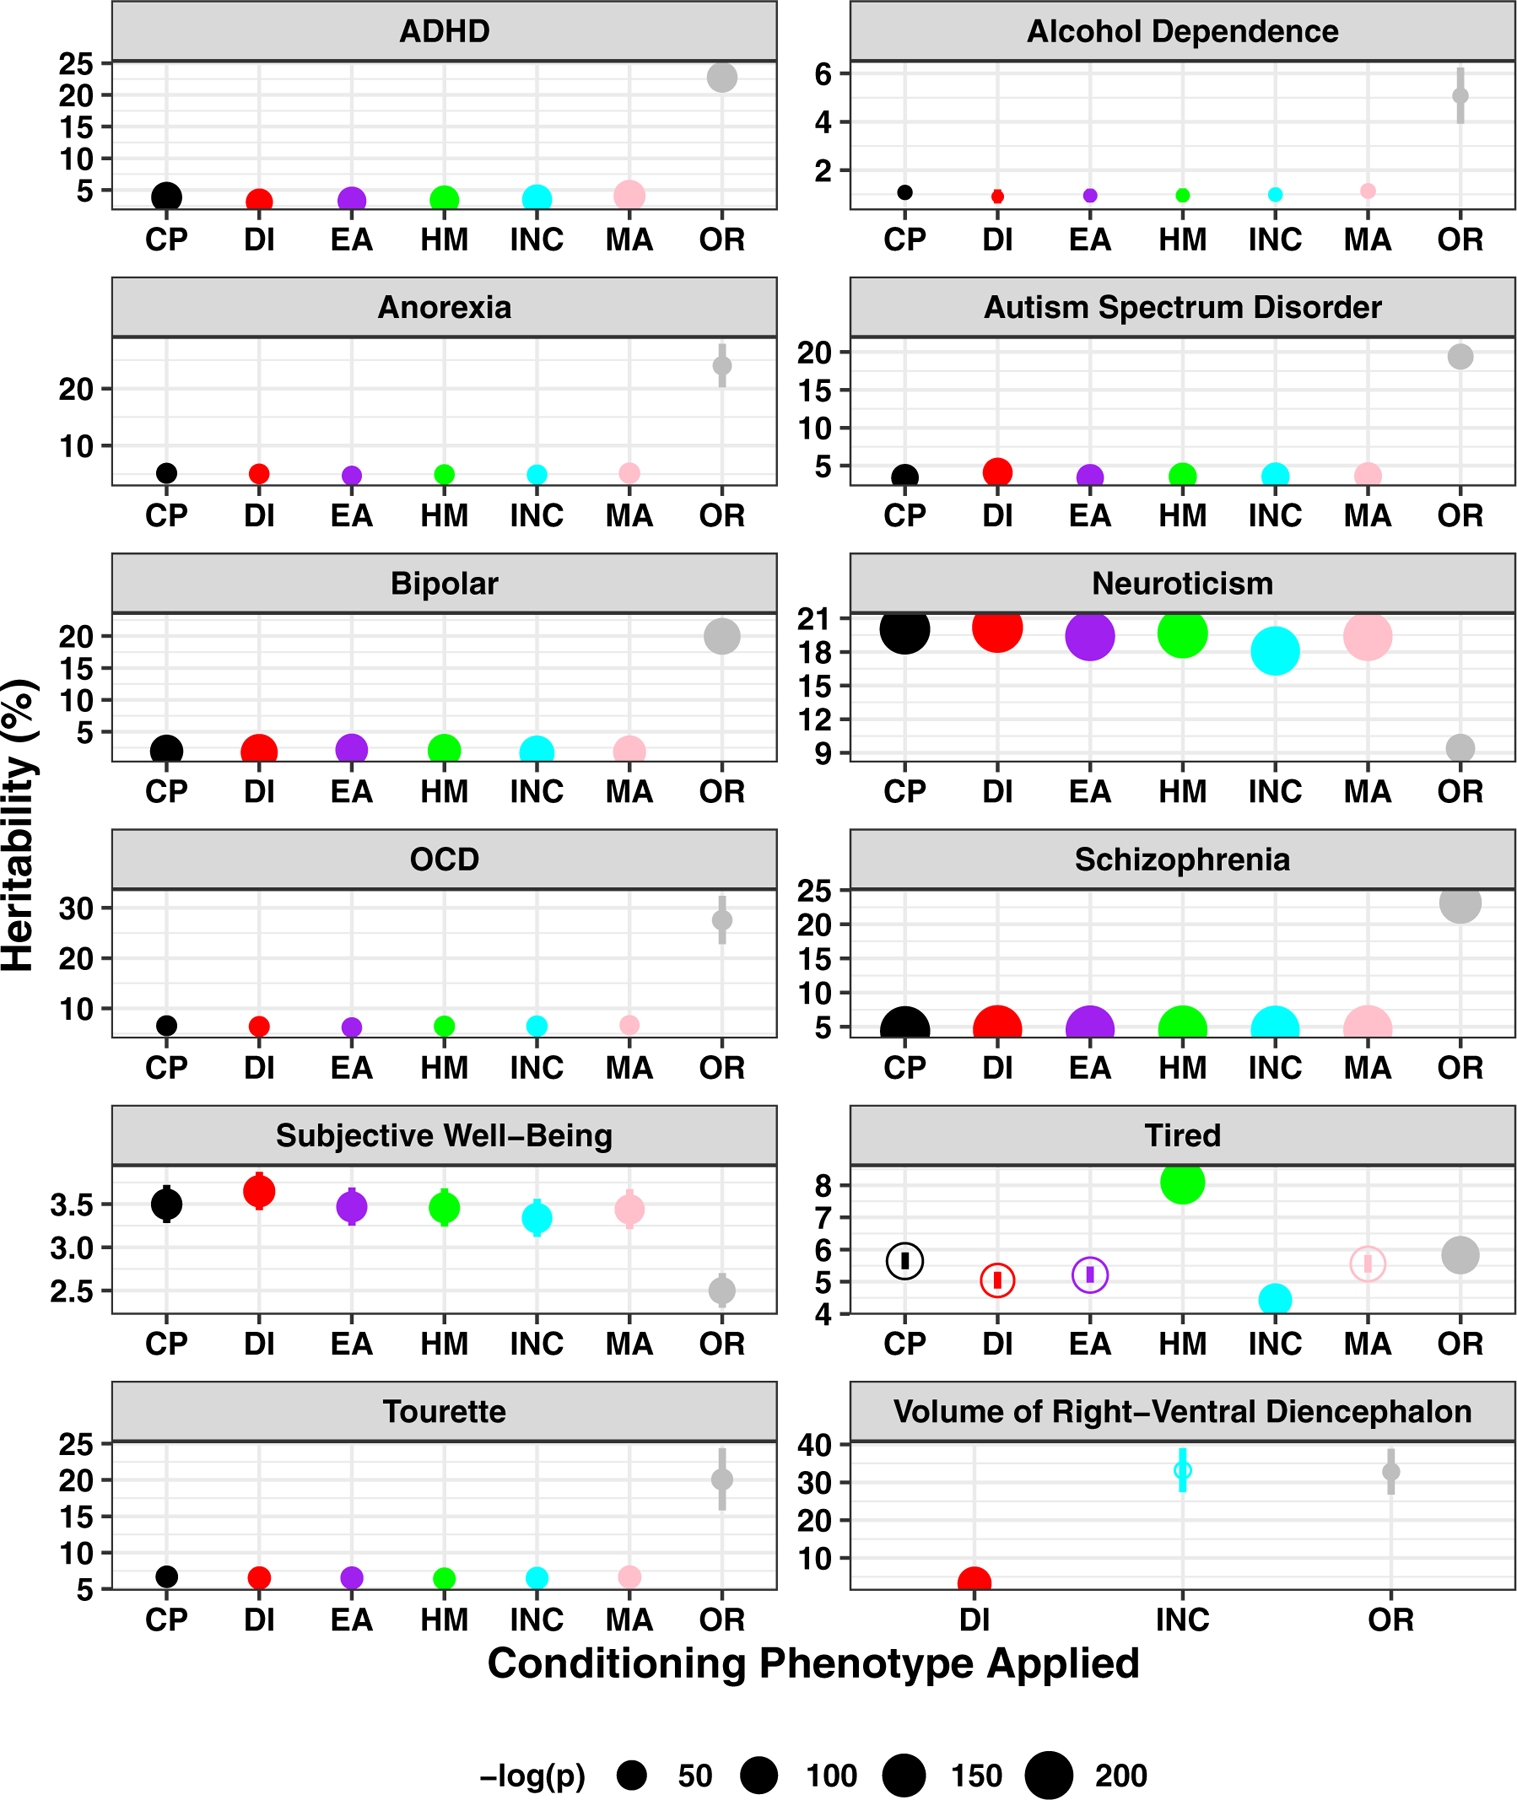
Fig. 2. Heritability (h2) changes.

Each data point indicates an observed-scale h2 estimate and standard error of the original (OR; grey) indicated phenotype or that same phenotype after conditioning with education and socioeconomic status phenotypes (CP: cognitive performance, DI: deprivation index, EA: educational attainment, HM: highest math class, INC: income, MA: self-rated math ability). Two p-values are shown: (1) the h2 estimates of each conditioned phenotype was at least nominally significant (p<0.05) as demonstrated by the size of each data point, (2) solid data points indicate that the h2 estimate of a conditioned phenotype was significantly different from the original h2 estimate in grey. Phenotypes showing significant h2 changes are shown here while all phenotypes are presented in Fig S3.
