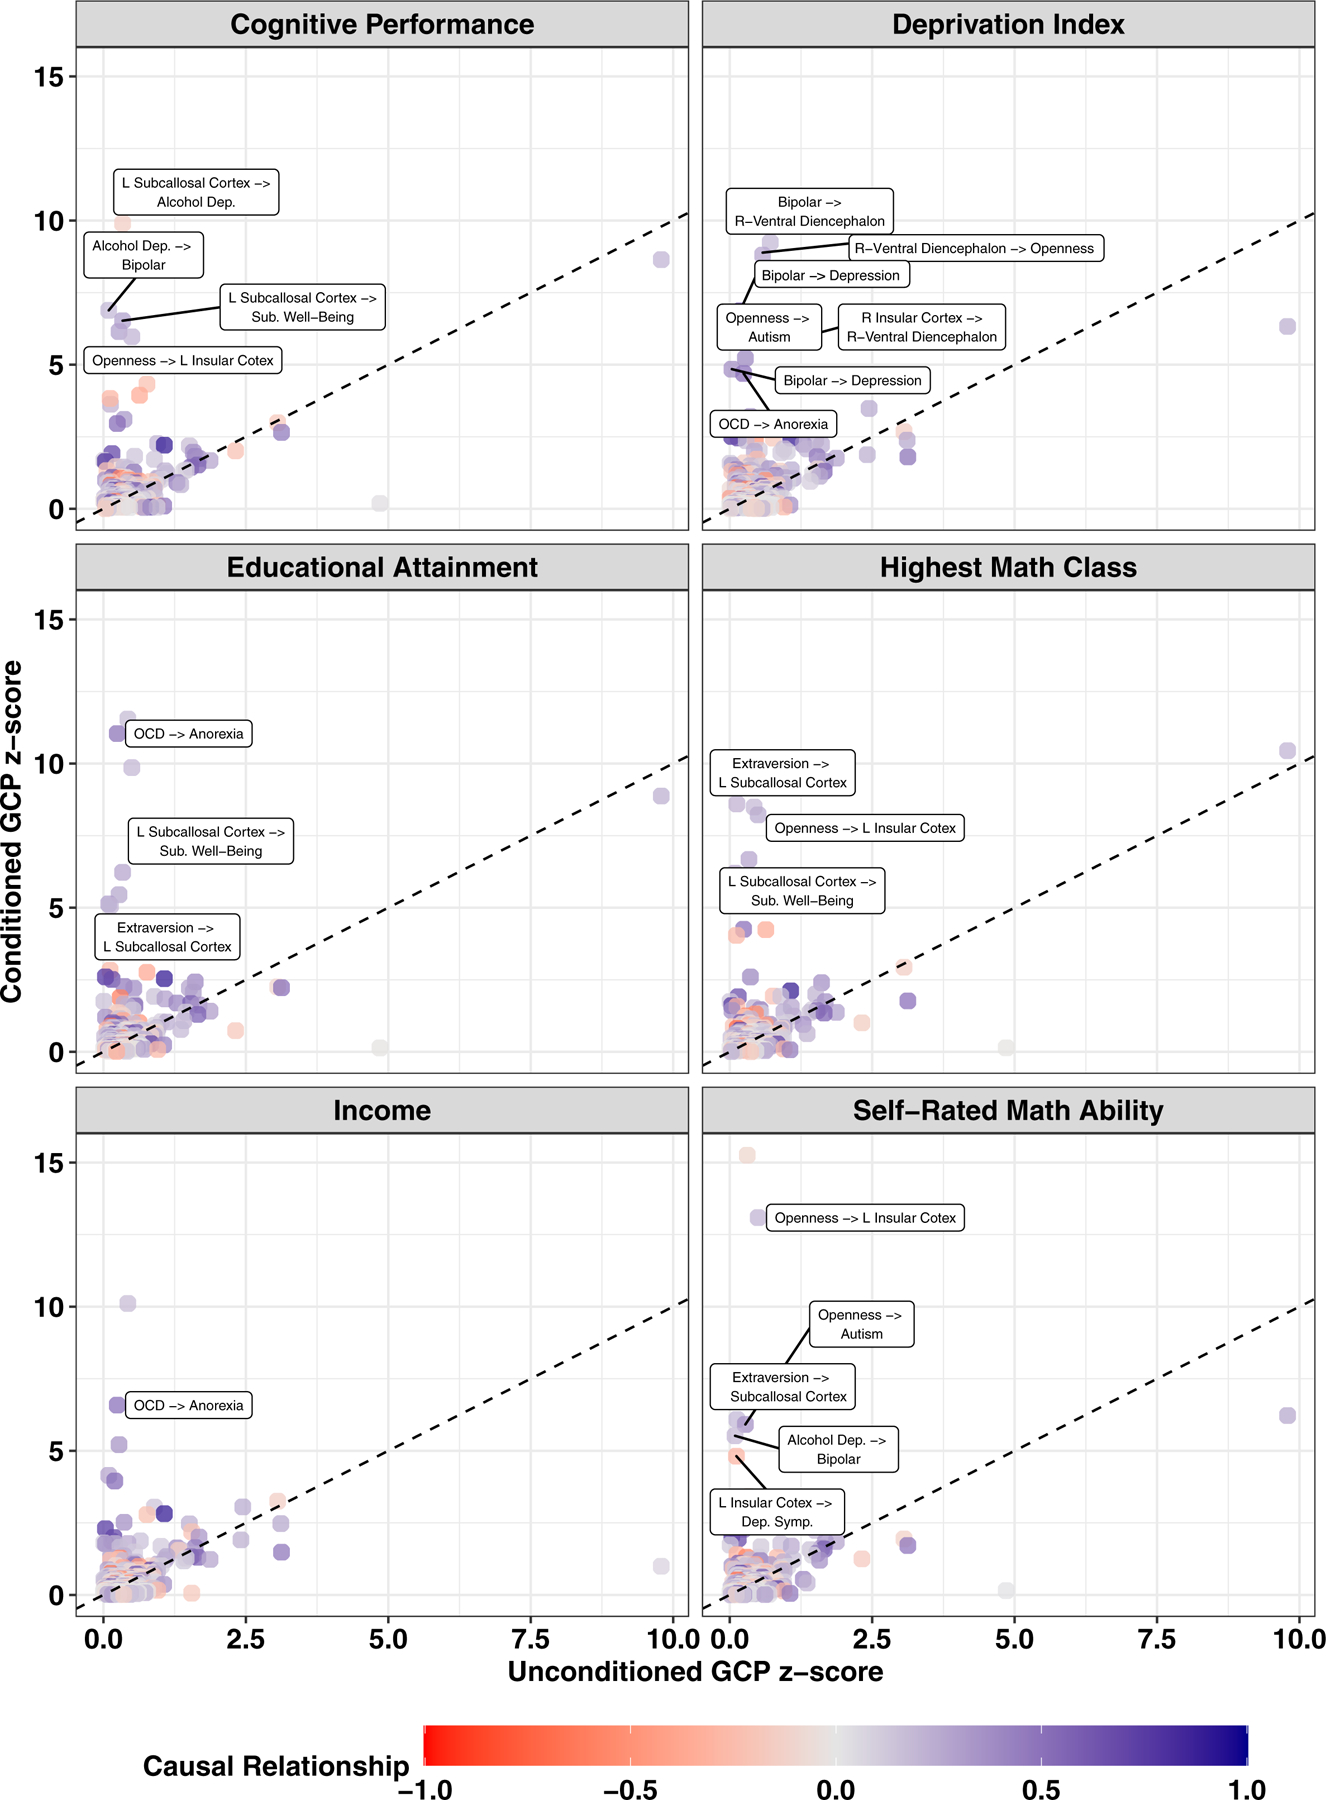
Fig. 5. Causal relationships masked by education and socioeconomic status effects.

Latent Causal Variable (LCV) results detecting putative causal relationships between the genetic risk for two psychopathology and psychosocial factors. Each data point indicates a trait pair comparison in which the y-direction indicates a causal estimate whereby both traits have been conditioned on one education and socioeconomic status phenotype. The color of each data point indicates the magnitude of causal estimate (e.g., causal relationship = −1 indicates that trait 1 decreases trait 2) The dashed diagonal lines indicates a one-to-one relationship between x and y axes. Significant putative causal relationships are labeled and described in detail in Table 1.
